IMPULSIVE AUGUST MARKETS - The S&P 500
We are in a "corrective market", so goes the headline. Since last Monday, the S&P 500 fell from 2103 to 1971. That is a 6.3% drop in the space of 5 trading days, the largest since - October 2014. Indeed, the impulsiveness of the correction mirrors events of last October.
Of course, the media argues 24/7 as to when the correction started and why. Was it the devaluation of the Yuan? Events in Greece? The commodity slump? A nightmare vision of Trump as President of the USA? In reality, once the selling starts, many punters ignore individual signals of their local markets, economic divergence or individual risk considerations.
They just get out.
But just what do you do, if you are still invested? And if you are out, when do you get back in?
- The Greece debt crisis is not over yet: the country is going to the polls - and might end up totally rejecting the tough measures of the recent accord. That would then become a trigger for much greater volatility,and cause havoc with currencies, again.
- China's economic data is being challenged: is the GDP data accurate? What parameters can we "trust"? Western rhetoric is getting more venomous. But the side effects are all too obvious: stock markets in Taiwan, Korea, South East Asia and even Australia have been in a down trend since March this year, quite clearly an impact of the Chinese economic slowdown that seemed more real in those more directly affected markets than those in Europe. Meanwhile, the US stock market continued to boom.
- This disconnect may be the cause of the ongoing corrective phase, with the possibility of a 10% correction as in October 2014.
The S&P 500
The technical analysis, using mainly Fibonacci parameters, does provide a few more connecting points:
- The correction in October 2014 took 29 days to reach the trough, with a total loss of 10% in the S&P 500 and just 19 days to fully recover. From there, it went on to higher highs.
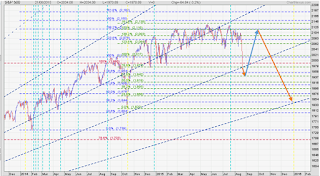
- This time, if we simply go by the price structure from 20th July as a peak, the correction has lasted 30 days, with a loss of 7.6% so far. This, and the impulsive moves of the last 3 trading days, suggests that the correction will extend another 1 or 2 days. Next Tuesday could be a turnaround day!

The extra 2 days (see short orange arrow) would make the structure complete: the trough would then be around 1942 mark, which would represent a 9.5% loss. From there, a strong rebound (blue arrow) could start with the likelihood of recovering 100% of the correction around 11th September (a Friday). Don't hold me to the 100%. But the time frame is correct, as it would be 20 days after the low.
That would be the best exit point for equity for quite a while!
Thereafter however, I don't expect a continuation to higher highs. Quite the opposite. The real correction (long orange arrow) could start then, extending far beyond 10% losses.
Unless you are a whizzkid with 'shorts', stay away from the equity markets.
This is the picture for just one index. Others, especially European, Japanese and Asian indices, show quite different structures are not anywhere near as bearish. Then again, the US indices have moved well ahead of all other global indices. The time for a reset is very near.


Comments