From Stocks to Gold - A week of mixed signals ahead!
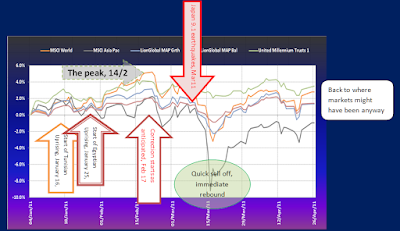
Today's a bank holiday in the US - and as so often when US stock markets rally into holidays, profit taking and some asset rotation is likely on a global scale in the aftermath. In practical terms, we could see further downside in stocks even in the US and Europe, - but pure technical analysis does not support this unequivocally. So don't go short based on this statement!
Asset Rotation into Gold
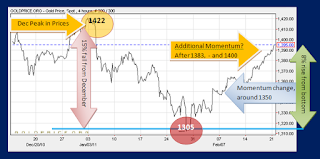
There is little doubt in my mind that gold has become an integral tool in the tool kit of big investors. As a result, fluctuations in gold prices are anything but tepid. A recent asset rotation exercise out of and - back into - gold is a perfect example:
Prices fell as low as 1305 earlier this month but are now attacking the 1400 level again. -15% down and +8% up in the space of 6 weeks are huge swings in prices by most standards, with little fundamental reasoning behind it, except - making a quick killing. The present price structure suggests a momentum change occurred after Chinese New Year, already (proceeds from Asian stocks?). But I would point to TODAY for an acceleration of this buying momentum, as prices brush aside the old and formidable resistance level at 1383. A breakout past the 1405 / 1412 / and indeed 1427 levels would indicate that this move is well supported and sustained. There is little to suggest at present that these levels will not be surpassed by the time we reach end of March.
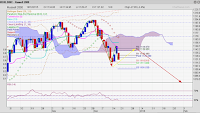
In recent weeks, I am limping behind in my calls for gold for some reasons. I actually cautioned to enter gold at this point, waiting for breakdown below the 1300 level instead, as my technical analysis seemed to suggest. The chart on the right is produced by Henning Schaefer, Astro Cycle Specialist in Germany. His forecasts are typically well researched and offer very good support for momentum turns. Upon closer scrutiny it appears that - for some reason - time seems to rush 'things': Actual prices follow the indicative path in the forecast , but not the time pattern. We can clearly see the parallel movements / correlations between the two charts, - but the actual corrective low point has come some 3 weeks early and prices now are reaching for peak levels we expected to see by end of March!
Time leaps can happen when liquidity is artificially enhanced (QE 1, 2), almost always to the detriment of a bearish scenario. This time it could mean that the upside targets might be trashed, with gold prices gunning for the next psychological pivot point of 1400. The only thing speaking against it is a potential momentum break in the second week of March. We shall have to wait and see.
PLEASE REMEMBER, GOLD PRICES ARE INVERSELY CORRELATED TO US DOLLARS MAINLY and are not just the result of a Supply and Demand rule. For SGD investors, the changes in momentum, profits and losses can be quite different due to our currency's rising strength and fluctuation against the US dollar.
Asset Rotation into Gold
There is little doubt in my mind that gold has become an integral tool in the tool kit of big investors. As a result, fluctuations in gold prices are anything but tepid. A recent asset rotation exercise out of and - back into - gold is a perfect example:
 |
| Asset Rotation into Gold - after a 15% correction |
In recent weeks, I am limping behind in my calls for gold for some reasons. I actually cautioned to enter gold at this point, waiting for breakdown below the 1300 level instead, as my technical analysis seemed to suggest. The chart on the right is produced by Henning Schaefer, Astro Cycle Specialist in Germany. His forecasts are typically well researched and offer very good support for momentum turns. Upon closer scrutiny it appears that - for some reason - time seems to rush 'things': Actual prices follow the indicative path in the forecast , but not the time pattern. We can clearly see the parallel movements / correlations between the two charts, - but the actual corrective low point has come some 3 weeks early and prices now are reaching for peak levels we expected to see by end of March!
Time leaps can happen when liquidity is artificially enhanced (QE 1, 2), almost always to the detriment of a bearish scenario. This time it could mean that the upside targets might be trashed, with gold prices gunning for the next psychological pivot point of 1400. The only thing speaking against it is a potential momentum break in the second week of March. We shall have to wait and see.
PLEASE REMEMBER, GOLD PRICES ARE INVERSELY CORRELATED TO US DOLLARS MAINLY and are not just the result of a Supply and Demand rule. For SGD investors, the changes in momentum, profits and losses can be quite different due to our currency's rising strength and fluctuation against the US dollar.


Comments