Posts

Showing posts from April, 2016

Financial Markets Out Of Sync Part II a)

Image
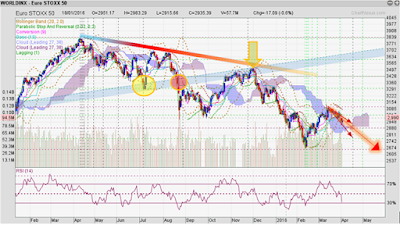
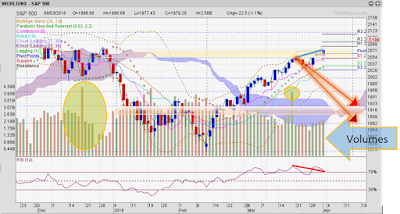
US and Europe - SHORT TERM UPDATE Before looking at Asian financial markets, allow me to briefly update you on what has transpired since I wrote part I & II in European an d US indices.  USA indices DJTA, short-term view: March peak, followed by the expected correction, DATA SOURCE: chartnexus The only index in the US, complying with my arrows is the Dow Jones Transport Average (DJTA), and it is taking the less precipitous path. The S&P 500, DJIA and RUSSELL 2000, are in sideways consolidation since the peak on March 22, without a meaningful decline . However, that is only half the story.  USD,October 2015 - today, fitting well into Fibonacci patterns; DATA SOURCE: chartnexus The USD has been losing strength against many world currencies in recent months, - just as I had envisaged  in November 2015 . Back then, everyone expected the USD to grow stronger in anticipation of the four interest rate hikes in 2016. Well, we have learned since that Ms Yellen i

Financial Markets Out Of Sync Part II

Image
In continuing our short-term assessment of financial markets, today's report covers European ind ices.  If you want to check back on US and Canadian indices in Part I, click here . Last Sunday, I concluded that a new leg down in equities has started. It should reach a first significant low point around April 18, +/- 3 days. The sell-off could be strongest in large and mega cap stocks. Can this be confirmed by the cycle research in European indices? Part II - European Equities I indicated earlier that European equities have been correcting since last April.   1. EuroStoxx 50 EUROSTOXX50, a 1-year view: a 1 year correction that has more downside to come. DATA SOURCE: chartnexus In this chart I want show you how the price moves formed, where we are at now, and the outlook for the next few weeks. The peak in April 2015 is very prominent. Visually, it is also the starting point of the downturn. Focussing on the left half of the chart, please observe how this gradual d

Financial Markets Out Of Sync Part I

Image
click here for  Financial Markets Out Of Sync Part II In my last post, I reintroduced my model . How else can I prove that my work carries benefits? Soon, I will elaborate on the model attribution, its strategy, and the reasoning behind the tactical changes over time.   Today, it's all about WHERE WE ARE RIGHT NOW with the markets. Last week, I said, global equities are getting out of sync. Now we can show how disjointed the markets have become. The information may help the experienced investor, though everyone wants direction and targets for future market moves. I will do so in this report, valid for the coming weeks, covering equities, commodities and currencies, each asset class in a separate blog post. It's an extra chance to adjust your positions accordingly, if you think my mumblings make sense.  Part 1 EQUITIES - USA and Canada equities I will show charts of Northern American, European, and Asian indices. You will note the divergence, and the red fat ar