Posts

Showing posts from October, 2016

OCTOBER TURNS, PART 3, the US Dollar

Image
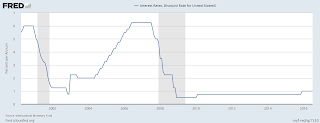
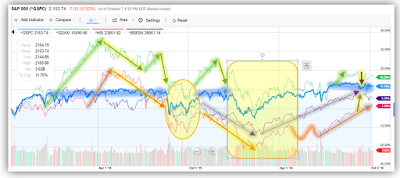
USD PEAKS  It is time to take a critical look at USD charts in light of noises about a December interest rate hike, AND because I got it so wrong in my prognosis in September , when I said the dollar should start to soften, and allow gold prices to slowly get into rallying mode. We saw quite the opposite and the portfolios suffered as a result. Looking Back - A Quick History Some time in August 2001, the USD stood at an alltime high of 121. The dot.com bubble had burst and its correction was in full swing. For investors,the USD stood for surety and a safe haven to shore up against a stock market that was falling apart. Everyone rushed to buy the dollar! Interest Rates and The USD SOURCE: FRED ECONOMIC DATA; US interest rates from 2001 till today.  But the crisis quickly engulfed all global economies. From a peak of 6.25%, the Federal Reserve had to reduce interest rates to 1.25% over 12 months and a bit lower still in 2003. When the global economies eventua

OCTOBER TURNS, PART 2

Image
Stock Market Divergences The curious thing about divergences is they can last for months, sometimes even years before they dissolve and turn into one big market convergence again. As long as one economy, - the US -, is the global leader, a return to correlated markets is what most parties wish for. Divergence occurs - as an exception, when regional economies are running into headwinds - by plan or by chance. Few people are able to predict the exact time of change from divergence to convergence, but - stock market cycles, seasonal behaviour, even statistics can become the proverbial "straw that breaks the camel's back". If we just knew, which one! Therefore, we reluctantly accept that there is no ONE measure tape, which tells us for sure, when a stock market rally comes to an end, BEFORE it happens. Divergence Pictured: Over the last 2 years, the divergences in trend between the US stock market and the rest of the world could hardly be any starker: Source: Yah

OCTOBER TURNS Part 1, Gold

Image
October 7, 2016 A Month With A Bad Record! Statistically, October has the worst record for stock markets. So far, I am inclined to say, it's happening again. Indeed, s ometimes, markets leave me speechless. This week for instance.  Last Friday (September 30), we still paid $1324 for the ounce. The rally seemed intact, the USD range bound.  On Monday, some profit taking set in, nothing out of the norm, as gold prices retreated to $1313. Tuesday morning still looked fine. And then, from 1 p.m. to 10 p.m. (end of day trading in the US), gold fell to $1268, a loss of 3.5%. That price level I considered save for a number of reasons, had it not frequently proven to be a formidable support level. But it wasn't to be. Today, Gold is priced $1252 at their lowest point, and I am not convinced that this is a level from which to expect a rebound. Indeed, right now, the best thing for prices to happen is to retreat to $1200. From such an oversold position at least, the rebound wil