Posts

Showing posts with the label S&P 500

US ELECTION - A FOREGONE CONCLUSION?
Image
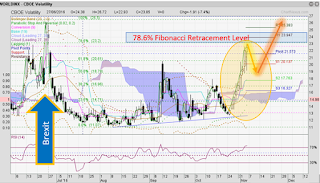
Equities from Australia to U.K, are having a bumper day (November 7, 2016)! Stock market investors are said to have responded to the FBI's decision not to go after Hillary Clinton. Looks like these guys want a lady as the next US President. But the turnaround could also just be a relief rally BEFORE the next rout starts. After all, if the race to the presidential finish line turns out to be as close as reported, we will only know more by next Wednesday morning. Source: chartnexus, THE CBOE Volatility index, June 2016 till now. Source: chartnexus, S&P 500, as BREXIT NO VOTE HITS. The CBOE volatility chart provides insight into the currents in the marketplace: Focus on the left of the chart, above the "BREXIT" ARROW. The last big spikes occurred end of June in conjunction with the shocking No Vote in the UK, opening the door to the BREXIT, the exit of the UK from the EU. The chart movements then are relevant to today. Initially volatility ro...
The Eternal Bull Run Or....

Image
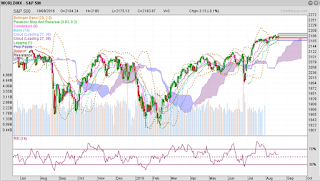
STOCKS RUNNING OUT OF STEAM... Investors keep telling me that their portfolios did not perform, while markets seem to have run up to new highs month after month.  Is that a fair assessment? Just a reminder to the reader: My investment strategy is medium term say 3-6 months, i.e. short term (days or less) consideration are really only important to me when I look to make changes to a portfolio. Anything said in this blog, be it outlook or forecast does not refer to tomorrow or end of the week. I only talk about the next 6-12 weeks' financial market probabilities and how I intend to trade. For more on my strategy please go to this page. Global Indices To check what happened over the last 12 months or more, I'd like you to take a look at the sample charts from the US, Europe and Asia in their respective currencies. US indices S&P 500, 1-year view, 2 major corrective moves; source: chartnexus S&P500: The large caps were favourites for many years but i...