Posts

Showing posts from 2010

"Soft Landing" ahead!

Image
Merry Christmas 2010   As expected by our cyclical research, markets are treading a bit softer over the coming few trading days before a final push into the New Year .  Whether the actual downside pressure will amount to much remains to be seen. I don't see swings of more than -2/-3%.  This softness in the markets will manifest itself different in the various countries and sectors, - which is really what we are seeing in our portfolios at the moment: Gold rallied into $1425  (Dec 6), and is on a slide since. I expect prices to remain above $1360 per ounce. China stocks are having a tough time rallying, and even Indian and Singapore indices are somewhat lackluster.  Currencies continue their rollercoaster moves.  In other words, nothing out of the ordinary for the Christmas season: lower volumes, the annual window dressing exercise by institutional investors, clearing the deck of non-performers and of course early profit taking. Overall our portfolios are mildly in plus after
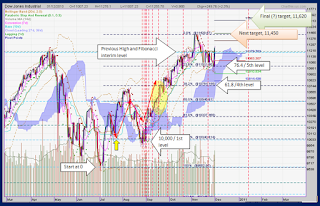
DJIA – Dancing a Two-Step to Fibonacci Score

Image
When it comes to Mr Fibonacci, his "levels" are as attractive as Casanova in his heydays, - that is to DJIA investors at least. The chart shows you just how much swing is in the daily steps, hitting the levels as if they were mere rungs on a ladder or musical scores.  Rising through Fibonacci Levels The rally arguably started in July, but you could also take the mid August low as the starting point, after the Dow temporarily broke below 10,000. The recovery was prompt and V-shaped; the rally went on in a grand way since. In October, the index passed the 4th level and then settled between the 5th level and the previous high in April.  November saw it bursting the range and running up to a new high for the year. Solid resistance blocked its path below 11,450. Since then, it fell back to the 5th level again, doing a two-step-up-down move every other day.  This Wednesday, it finally broke out of the narrow trading range, strongly moving toward its next target (mid December) of

All That Noise...

Image
Well, it's inappropriate to placate the Korean skirmishes as "much ado about nothing". But the media's response is certainly over-dramatising it, and inappropriately so, when they claim that yesterday's bloodletting in Asian indices had anything to do with North Korea's desperate call for attention, military style.  The first missiles hit the South Korean island at about 2:30h, with the barrage lasting about one hour. The South Korean index showed almost no reaction at the time and closed almost unchanged on the day of the attack. This morning we notice a knee-jerk in valuations at the opening, only to be completely retraced midday.   Other indices like the STI below, were already on a downward slope, which simply continued without any reference to the trouble in Korea. What many fear now is that trouble keeps escalating, in Korea, with the European PIIGS, or any other misadventures courtesy of QE. What few acknowledge is that we have probably already t

Global Markets - A few days in the RED - and then?

Image
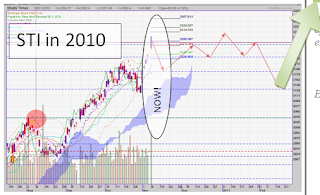
Many times I have outlined views on the main driver of global capital markets, the indices in the US, simply because of their close correlation to stock market affairs in Asia.  Today, I want to comment on issues closer to home.  In our SC Monthly Market Outlook, published in the first week of November, I commented on the STI, drawing a few directional arrows into the topical chart to outline the likely path for the coming weeks.  The STI has already reached  heights of over 3,300. My research suggests that advancing from this level will require another QE because QE2 has extended gains beyond forecasted levels. The chart on the right shows the index right up the announcement of QE2. Respite came promptly in recent days, with a chance for overbought conditions to normalise. On the right is the updated chart including the last few days' action.The sequence of red arrows start on the announcement of QE2 (red triangle). The big orange arrow points to where we are now. Nice enou

POMO - The New Kid On The "Blog"

Image
What is the point of working with technical parameters when they go out of fashion! Today I was introduced to the indicator that throws all others in the bin, potentially: Called POMO - Permanent Open Market Operations , it tells us when the FED goes on a shopping spree in capital markets.  And they even announce when they are buying - and how much there are willing to spend. Word in the Street has it, that on most such occasions, markets turned, often sharply, up. This - now very regular - intervention negates in particular expectations for the downside, i.e. bears are becoming frustratingly sidelined.   The motto: if the sun shines, fine, if it rains, get the FED. Hurray, no more down-days. That is exactly what happened last night, too: we saw Asian and European stocks taking a well deserved breather, - but as soon as the US markets opened - and fell by some 100 points, in the breach they sprint to save the day with a small plus, - good enough to turn the rest of the global trades

The FED speaks - and Investor Hearts Miss a Beat!?

Image
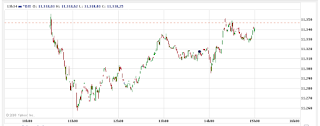
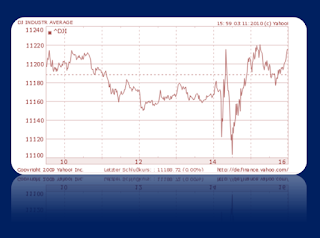
Just a brief interlude for your enjoyment!  The rude awakening may come later... Yesterday, the FED managed to move (index-) mountains,short term:  In the run up to the announcement on the latest QE, a lull was in the market (DJIA 1-day Chart, on the right). Then we see a sudden exhilarating, erratic move, much like on an ECG.  Jolted into action, prices first moved down, then up, down further and finally up, with more emphasis.  Sounds great until we note that actual volatility is less than 1%. It suggests that rather than missing a beat, investor reaction was that of geriatric fingering on the keyboard...  I am not good at dissecting FED messages in search of mystical clues and hidden meanings, so I will refrain to comment on the actual QE proposal.  Most of my readers know by now that I am with the hawks on this.  I am not convinced America can spend itself out of the mess they created, especially when America's investors don't invest in the US or the USD anymore!

"Inflection Point" in the stock markets

Image
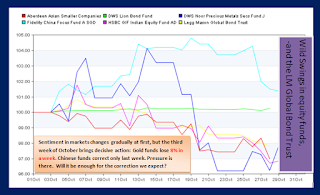
Overview   Short term review If you thought that funds had had a better week than last, this will disappoint you: more than half of our funds recorded negative performances again, with the worst results in bonds of -0.8% and -2% equity funds. Asia is at the forefront of the losses: India, China and Thailand funds. The best fund return we record for this week is just short of 2% (LionGlobal Taiwan), representing a lagging market.  On a monthly basis, -2.5% shows up as the maximum loss. The best monthly returns (only 5 funds above +6%) have been realised in Asian and Latin American funds, which have one main theme in common: Global Resources.   In other words, lowest and highest returns between diversified equity and bond funds are just about 4% apart, much closer together, than the propagated New Bull Market scenario would suggest.   Looking into this week's real events Marc Faber, one of the more reliable and sensible commentators on global stock markets, termed the curren

A Parttime Pullback, - is that it?

Image
"Never Bet Against the Fed"   It is an old saying and of course, every time they say it, we wonder whether it still holds true.  Despite the blatant FED intervention in currencies and capital markets, we forecasted a pullback of sorts, let's check and see: At SingCapital, we run a best fund list (mutual funds), consisting of 97 funds, covering all asset classes and regions.  Out of these 97, 62 are in the red for the last week, including some bond funds. On a monthly return, almost half of them record a negative performance.  The ones, which recorded peak performance recently are those connected to Global Resources, like Latin America and China, while Gold related funds had a wild ride up, only to break down rather quickly thereafter.  Remember my forecast of last week: the first effect to show up to confirm a major peak and turnabout was ... "Gold prices to fall below $1338 per ounce." We can tick this one off then. In tandem, I expected a turn in the di

A GRAND FINALE!?

Image
On the surface  The superficial observer might say, "nothing has changed, since last week". That is just it.  Time has passed. And one week in stock market terms is long indeed. Rarely has there been a week like the coming stirring up my apprehension as I agonise over two extreme outcomes:  The rally continues - Are we going to be bamboozled by a complete negation of stock market cycles? -  The correction comes - and we'll be knocked for six by a crash that ranks alongside 1998, 1987, 2002 - even the one, 80 years ago from which it took 15 years to recover?.  Drama?  You bet. CRASH OR EXTENSION OF THE RALLY? For complete remission of the "cyclically confirmed" downside potential, we don't need too much imagination:  If one trader can cause US indices to go into free-fall (-10% in 20 minutes, in May), we could easily envisage the world's key decision makers finding ways to do the opposite and -mustering the firmest of resolves - use every means at th

CHINA - a new 5-Year-Plan => a new 5-year bull market?

Image
"Conquering" the rewards offered by Chinese stocks, we are diverted mainly to those available in Hong Kong (Hang Seng), or our STI. The few stocks that are listed on major indices, or the so called Greater China regional benchmark are greatly diluted by currency fluctuations and foreign investor activity.  An Old Story I have been highlighting in every seminar in January trough to September that it is the emergence of China's own stock market trend, which would change investment parameters around the world in a big way. It is happening! Indeed, we need to look toward August 2009, when the stocks in Mainland China recorded a yearly peak, in line with global equities but then started a highly significant correction, following government intervention to an overheating economy and house prices in particular.  The correction lasted almost a year with a final bottom in early July this year, - just as I had indicated in our China Seminar in July. The sole reason why this i

"Heads We Win, Tails We Win"

Image
Faced with some scurrilous comments about "missing the boat" in an upward trending market recently, I am going to stretch your grey cells a bit today, - if I may?! Firstly, exiting equities early September and staying out of the markets since then was a tactical move to stave off any negative impact in light of deteriorating fundamentals and a slue of technical indicators.   Secondly, switching back into equity - during the second week of September - was an option:  based on weak trends (low volumes, overflowing liquidity)  against a negative cycle, but supported by reasonably strong technicals, especially for Asia.  Thirdly, using our investment tools (unit trusts, traded on platforms), we would struggle to switch in time and - so we presume still - switch back out in the space of - what? - 3 weeks! That is why we did not follow the signal.  Now, there are some who say, actual results prove me wrong.  Let's see:  Here is the chart for the DJIA in the US, s

Cruising at +10% above the capital markets

Image
Our Model Portfolios - still cruising at a high altitude to the markets latest update October 14, 2010 MODEL PORTFOLIOS SWITCHED TO A SAFETY FIRST PORTFOLIO ON SEPTEMBER 6th, 2010.  We chose bond funds and money markets.  The strategy was to benefit from expected market turbulence and a rush to safety - when the markets correct. - As we saw the rally continues. What should be clear to every investor now is that this rally is running on the back of liquidity only, and not real demand and supply functions.   Graciously, our arch-conservative strategy worked nonetheless, as many bond funds rallied in tandem.AND the SGD continues to outperform against just about every notable currency. By switching to safety the maximum gain portfolios missed amounts to about 4.5% (high risk profile), less than 3% for the balanced portfolio.   There is an extra page on this blog dedicated to the updates on the models. Unless you have a portfolio with me, these models mean little to you, -