JAPAN - Part Three: Concluding, Including, Looking Ahead
This is the concluding part of our mini-series, which focuses on the recent tumultuous events, namely the triple calamity in Japan, the 'Arab Spring', and Europe's problems with its peripheral states.
I guess, it is now obvious that neither of the events turned into the one-off, exceptional occurrence that would destroy market values for a longer period. For most part, they appear to be starting point for change, fermentation, and portent factors for the future, all rolled into one. Each of them has the capacity to bring about a new tomorrow - for better and for worse. Hence, to stand here and say, 'this is my final conclusion' must sound argumentative at least, contentious even.
But every series must find an end. Admit it, it gets boring when asked to read part 4,5,6,7... I simply lose track on what was said before.
DID THEY OR DIDN'T THEY?
No matter how disastrous the suddenness of forceful change impacted on each region and its people almost simultaneously, the 'world' has done no more than to 'move on', taking it into its stride, and that is especially true when it comes to financial markets.
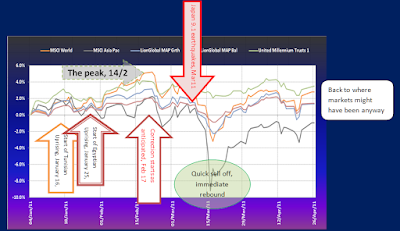
Overview market benchmarks and events: If markets had corrected without a Japan quake, valuation levels would probably be the same?
We argued in part 2 that events like the revolution in Tunisia, Japan earthquakes and even a nuclear disaster hardly cause a ripple in financial markets. The chart here confirms this once again.
Of course, the aftermath thereof could influence longer term trends, - if a trend change was in the offing anyway. This can be said about old and new ideas now circulating about the use, risks and future of nuclear reactors as an energy resource. A similar observation can be made with respect to how Europeans deal with government debts, mismanagement of national economies and currency - and where to make a firm stand! From an economical point of view I would term the latter as explosive a situation as the unresolved dangers resulting from the damaged FUKUSHIMA reactor, possibly worse, because you can't just "bury" credit woes in a "concrete sarcophagus" (=the Chernobyl nuclear reactor).
The 'Arab Spring', however, is taking on a long, slow ascension to prominence, with the luck of two early successes in Tunisia and Egypt. The future path is bound to face struggle, injustice, ideological confrontation and personal sacrifice, all hallmarks of revolutions gone by. To doubt its eventual success is doubting the evolution of humanity, which is as inevitable as time edging ever forward.
By now,all these events have become every-day-news, mashed up with the rest that is produced by our media machines:
Portfolio Management Decisions
Switching to cash, we have been watching events in the markets from the side-lines since April 8th. Up until then markets had seen an almost 100% retracements of the drawdown of March 14-17. Did the latest move make sense?
Read my comments in the previous article, dedicated also to the movement of gold prices. In short, I am totally convinced that it was right and beneficial, despite the adrenalin pumping climb of gold prices. The low point of the current consolidation phase is expected sometime next week +/- 4-5 days, i.e ANYTIME NOW.
Brief Market Positioning

The gold pullback of 7% in just 3 days only
Gold prices dropped 110 points from a high of 1570, in May 3rd to 1460 on May 6th.
The USD rose 3% against most currencies, except the Yen, a jump that occurred during a single trading period, last Thursday night.
 USD, a ONE DAY WONDER last Thursday!
The two asset types react inversely to each other. The move therefore should be seen as a very selective profit taking exercise, while other asset classes in financial markets generally saw much less volatility. I would not be surprised if markets will correct further next week after a brief attempt to consolidate.
Market outlook into autumn
This is a trial report, attempting to gauge potential changes as a result of fast changing geopolitical and socially volatile world. At this stage, I reserve the right to change my mind without notice! I sense that we will need to review our positions more often than we would like.
Gold Prices and Commodities
After reaching giddy heights in their valuations, this asset class was most prone to a correction. The fact that its sell off resulted in an immediate and sharp rebound in the USD points to a speculative investor, and one that will not so readily return to the same asset class.
Cyclically, gold ought not to be playing such a prominent role till September at least, which could mean that as an asset class, its prices will see more of a sideways move. It might also suggest for the USD to stay uncharacteristically stable, despite the obvious downward trend on display. Here we need to remember that a complete wipe out of the currency is not something many wish to see at this stage in the cycle.
Silver is closely tracking the directions of gold prices, just taking larger steps. The entire segment had its peak in early March. Since then we saw a significant sell-off.
 To better assess this complex industry, we should divide it into two parts: those commodities to be used with infrastructure and those to do with food (often referred to as soft commodities). The latter are in the thrall of inflationary pressures, while infrastructure projects appear to be less pressing, having purchased all that is needed. Commodity prices will therefore be cooling off a little more, especially if the USD remains steady.

Other commodities (Commodity index chart on the left) have been rallying for a year now, - and it is all too easy to expect a trend change at this stahe. Everything depends on where the USD is going to move next...
Japan
 Facing the cost of rebuilding large parts of its country at a level even greater than Kobe, many are worrying about Japan's ability to pull it off.
Actually, the deflationary period of the last 25 years could turn out to be a blessing of sorts: The JCB can - and does - quite happily print a trillion notes without rocking the boat on inflation. Indeed, they may, - no, will - escape the deflation phase and get back to the normality of an expanding economy, such as rising prices and rising salaries, and ready credit for infrastructure renewal.
 The country is benefiting from every ounce of inflation put into the system for Japanese companies would be empowered to expand along with the surrounding Asian economies.
The chart on the right includes updates to Friday 6th May, pretty much in line with expectations (green arrows above chart)
You will notice that the Nikkei regained much of the downside suffered earlier. Indeed, please bear in mind that the Yen has appreciated, too, suggesting that we are not very far off the highs in early March from an SGD investor point of view.
Technically speaking, Japan indices are trading at a discount of some 40%. This is the growth target I would set until the middle of next year! Therefore. I maintain my positive stance on Japan.
Global Market Aspects
 Since early April, the start of the correction, we have seen a turnaround in cash flows (Asset Rotation): Initially exiting in the first quarter of the year, investors are keen to re-enter the emerging market segment and everything that is connected with it. I think this sentiment will continue - and should expand to small caps, too. So, check the Asian small cap funds for first signs of renewed strength. They certainly corrected much less than their large counterparts in recent weeks.
China Mainland Shares
'A' Shares do not show quite the same positive picture. But as long as the current upward trend - denoted by the DARK RED LINE - holds, we might soon see prices breaking above the wedge that is suppressing present market action.
My indicative path, drawn in early April, certainly receives confirmation by actual market pricing. Then again, the yellow field highlights a much stronger trend pointing downward. So - overcoming the narrowing wedge and move beyond would be a major sign that a negative period has passed.
The Hang Seng is less negative in outlook, but also somewhat inconclusive in its sideways move. If we disregard the excessive reaction to the Japan disaster then a tentative upward trend (blue line) appears, but the trading range is between two Fibonacci levels. With the latest pullback, there is a decent chance for some gain in the near future, if you can catch it.
The US Markets
The US markets have been rallying over and above all other markets. To explain this we need to consider two aspects.
QE1 & QE 2 have bolstered investor confidence and company coffers, allowing a relatively care-free expansion of the economy, driving earnings and consumption.
In contrast the USD keeps falling. When looking at the DJIA on the basis of SGD, the highs did not come a few days ago, - but in February.
The chart's manually drawn projections assume correctly that we are in a corrective phase now. The DJIA was oversold in early April. But actual downside targets do not tally with projections. If we deduct points for a weak dollar, then the reality nudges closer to our forecast. But, liquidity will continue to push US stocks up.
Our STI
Below is another projection from early April, - checking the accuracy of our forecasting:
The chart leaves no doubt: I was expecting a brief pull back for April, followed by a rally into June. We have reached the low point of 3105 today, Friday May 6th! It's a bit later than in the chart, because the alternative turning window his come into play, rather than the primary at the end of April.
 Now we are waiting to see whether the second leg of the rally gets underway.
Conclusion
Few markets and asset classes now offer a clear path for the coming month. Cyclically, we were looking for a peak in equities to form in June, and that is still a likely scenario. The recent disasters have at least kept the manipulation of governments at bay, leaving markets to ‘repair themselves’ and become more in sync with cycles (and therefore easier to assess - theoretically). The time after June is marked as a ‘summer hole’, which is characterised by more sideways action, albeit it with higher volatility. Only those involved in actively managing portfolios should now attempt to catch the last ride up.
As valuations had been excessive before the Japan quake, many saw it as a trigger, a wake-up call, or at least “a good enough reason’ to readjust their strategy to realities on the ground, and thus the positive tone in early March gave way to highly volatile pullbacks and swift rebounds.
As a result most markets record little or no progress year-to-date, especially when viewed from a Singapore dollar perspective.
In a few weeks, decisions over the fate of QE2 should come to a head as the US decision makers mull over how to withdraw the benefits, fearing a backlash in financial markets if they get it wrong! Since it coincides with a peak for the year, the decisions may be ‘good’ for those who want the government to cut their spending, but ‘bad’ for those who fear its impact on shares and bond valuations.
HAPPY INVESTING
I guess, it is now obvious that neither of the events turned into the one-off, exceptional occurrence that would destroy market values for a longer period. For most part, they appear to be starting point for change, fermentation, and portent factors for the future, all rolled into one. Each of them has the capacity to bring about a new tomorrow - for better and for worse. Hence, to stand here and say, 'this is my final conclusion' must sound argumentative at least, contentious even.
But every series must find an end. Admit it, it gets boring when asked to read part 4,5,6,7... I simply lose track on what was said before.
DID THEY OR DIDN'T THEY?
No matter how disastrous the suddenness of forceful change impacted on each region and its people almost simultaneously, the 'world' has done no more than to 'move on', taking it into its stride, and that is especially true when it comes to financial markets.

Overview market benchmarks and events: If markets had corrected without a Japan quake, valuation levels would probably be the same?
We argued in part 2 that events like the revolution in Tunisia, Japan earthquakes and even a nuclear disaster hardly cause a ripple in financial markets. The chart here confirms this once again.
Of course, the aftermath thereof could influence longer term trends, - if a trend change was in the offing anyway. This can be said about old and new ideas now circulating about the use, risks and future of nuclear reactors as an energy resource. A similar observation can be made with respect to how Europeans deal with government debts, mismanagement of national economies and currency - and where to make a firm stand! From an economical point of view I would term the latter as explosive a situation as the unresolved dangers resulting from the damaged FUKUSHIMA reactor, possibly worse, because you can't just "bury" credit woes in a "concrete sarcophagus" (=the Chernobyl nuclear reactor).
The 'Arab Spring', however, is taking on a long, slow ascension to prominence, with the luck of two early successes in Tunisia and Egypt. The future path is bound to face struggle, injustice, ideological confrontation and personal sacrifice, all hallmarks of revolutions gone by. To doubt its eventual success is doubting the evolution of humanity, which is as inevitable as time edging ever forward.
By now,all these events have become every-day-news, mashed up with the rest that is produced by our media machines:
- "Obama takes out Osama" (said a graffiti at Ground Zero, New York)...
- "In the grip of election fever, Singapore's ruling party is fretting over a marching, noisy opposition." Election has come and gone!
Portfolio Management Decisions
Switching to cash, we have been watching events in the markets from the side-lines since April 8th. Up until then markets had seen an almost 100% retracements of the drawdown of March 14-17. Did the latest move make sense?
Read my comments in the previous article, dedicated also to the movement of gold prices. In short, I am totally convinced that it was right and beneficial, despite the adrenalin pumping climb of gold prices. The low point of the current consolidation phase is expected sometime next week +/- 4-5 days, i.e ANYTIME NOW.
Brief Market Positioning

The gold pullback of 7% in just 3 days only
Gold prices dropped 110 points from a high of 1570, in May 3rd to 1460 on May 6th.
The USD rose 3% against most currencies, except the Yen, a jump that occurred during a single trading period, last Thursday night.
 USD, a ONE DAY WONDER last Thursday!
The two asset types react inversely to each other. The move therefore should be seen as a very selective profit taking exercise, while other asset classes in financial markets generally saw much less volatility. I would not be surprised if markets will correct further next week after a brief attempt to consolidate.
Market outlook into autumn
This is a trial report, attempting to gauge potential changes as a result of fast changing geopolitical and socially volatile world. At this stage, I reserve the right to change my mind without notice! I sense that we will need to review our positions more often than we would like.
Gold Prices and Commodities
After reaching giddy heights in their valuations, this asset class was most prone to a correction. The fact that its sell off resulted in an immediate and sharp rebound in the USD points to a speculative investor, and one that will not so readily return to the same asset class.
Cyclically, gold ought not to be playing such a prominent role till September at least, which could mean that as an asset class, its prices will see more of a sideways move. It might also suggest for the USD to stay uncharacteristically stable, despite the obvious downward trend on display. Here we need to remember that a complete wipe out of the currency is not something many wish to see at this stage in the cycle.
Silver is closely tracking the directions of gold prices, just taking larger steps. The entire segment had its peak in early March. Since then we saw a significant sell-off.
 To better assess this complex industry, we should divide it into two parts: those commodities to be used with infrastructure and those to do with food (often referred to as soft commodities). The latter are in the thrall of inflationary pressures, while infrastructure projects appear to be less pressing, having purchased all that is needed. Commodity prices will therefore be cooling off a little more, especially if the USD remains steady.
Other commodities (Commodity index chart on the left) have been rallying for a year now, - and it is all too easy to expect a trend change at this stahe. Everything depends on where the USD is going to move next...
Japan

Actually, the deflationary period of the last 25 years could turn out to be a blessing of sorts: The JCB can - and does - quite happily print a trillion notes without rocking the boat on inflation. Indeed, they may, - no, will - escape the deflation phase and get back to the normality of an expanding economy, such as rising prices and rising salaries, and ready credit for infrastructure renewal.

The chart on the right includes updates to Friday 6th May, pretty much in line with expectations (green arrows above chart)
You will notice that the Nikkei regained much of the downside suffered earlier. Indeed, please bear in mind that the Yen has appreciated, too, suggesting that we are not very far off the highs in early March from an SGD investor point of view.
Technically speaking, Japan indices are trading at a discount of some 40%. This is the growth target I would set until the middle of next year! Therefore. I maintain my positive stance on Japan.
Global Market Aspects

China Mainland Shares
 |
| A Shares in a fix - a chance to break out is in sight! |
My indicative path, drawn in early April, certainly receives confirmation by actual market pricing. Then again, the yellow field highlights a much stronger trend pointing downward. So - overcoming the narrowing wedge and move beyond would be a major sign that a negative period has passed.
 |
| HANG SENG - offering only more sideways action medium term |
The US Markets
 |
| DJIA - Projections of early April 2011 |
QE1 & QE 2 have bolstered investor confidence and company coffers, allowing a relatively care-free expansion of the economy, driving earnings and consumption.
In contrast the USD keeps falling. When looking at the DJIA on the basis of SGD, the highs did not come a few days ago, - but in February.
The chart's manually drawn projections assume correctly that we are in a corrective phase now. The DJIA was oversold in early April. But actual downside targets do not tally with projections. If we deduct points for a weak dollar, then the reality nudges closer to our forecast. But, liquidity will continue to push US stocks up.
 |
| US Indices in SGD, - chart created on dollarDEX website |
Our STI
Below is another projection from early April, - checking the accuracy of our forecasting:
The chart leaves no doubt: I was expecting a brief pull back for April, followed by a rally into June. We have reached the low point of 3105 today, Friday May 6th! It's a bit later than in the chart, because the alternative turning window his come into play, rather than the primary at the end of April.

Conclusion
Few markets and asset classes now offer a clear path for the coming month. Cyclically, we were looking for a peak in equities to form in June, and that is still a likely scenario. The recent disasters have at least kept the manipulation of governments at bay, leaving markets to ‘repair themselves’ and become more in sync with cycles (and therefore easier to assess - theoretically). The time after June is marked as a ‘summer hole’, which is characterised by more sideways action, albeit it with higher volatility. Only those involved in actively managing portfolios should now attempt to catch the last ride up.
As valuations had been excessive before the Japan quake, many saw it as a trigger, a wake-up call, or at least “a good enough reason’ to readjust their strategy to realities on the ground, and thus the positive tone in early March gave way to highly volatile pullbacks and swift rebounds.
As a result most markets record little or no progress year-to-date, especially when viewed from a Singapore dollar perspective.
In a few weeks, decisions over the fate of QE2 should come to a head as the US decision makers mull over how to withdraw the benefits, fearing a backlash in financial markets if they get it wrong! Since it coincides with a peak for the year, the decisions may be ‘good’ for those who want the government to cut their spending, but ‘bad’ for those who fear its impact on shares and bond valuations.
HAPPY INVESTING


Comments