Falling Out of Love With The Markets?
A Valentine Update
A quote from an unknown trader:
"The Stock Market is the only market where people walk out when the prices have been slashed!"Today, I howl with the wolves: "Surely, at this price level you are not getting out of stocks?!"
Instead of support, my spam box is filled with useless e-mails, telling me how wrong it is to trust the markets at this stage, conjuring up visions of a repeat of 2008, and worse. It annoys me no end when the scaremongers manage to undermine many investors' ability to stand their ground.
I go with the saying, - markets aren't always right about where they are or move to, but the explanations for it are wrong most of the time. -
As much as I respect Ellioticians for their wave work (like my Indian friend Ashish), but on this occasion, his counterparts in the US take the biscuit of all the silly comments (but then what do they know about Neo Waves
 ?)
?) So that they can say, "I Told You So" later, they lay out 5 different scenarios, bullish and bearish, bullying and overbearing, with the worst case stuffed for the biggest stir.
Even today, when I would call at least for a ceasefire in the selling pressure, if not a turnup day, they are still on about, how it can only get worse..
My Work
Did I do any better? Here a few links to past posts on the various markets as far back as November 2015? Even on New Year's Eve I sent out an update. And you don't have to sign up for pay-3 get-4 product or something. You had it for free. In the right hands, it must have made you a packet.Let's check a few charts I published - and the actual outcomes.
US Stocks
 |
| NASDAQ 100 in Nov 2015 Source: Chartnexus |
 |
| NASDAQ 100, mid-Dec 2015 Source: Chartnexus |
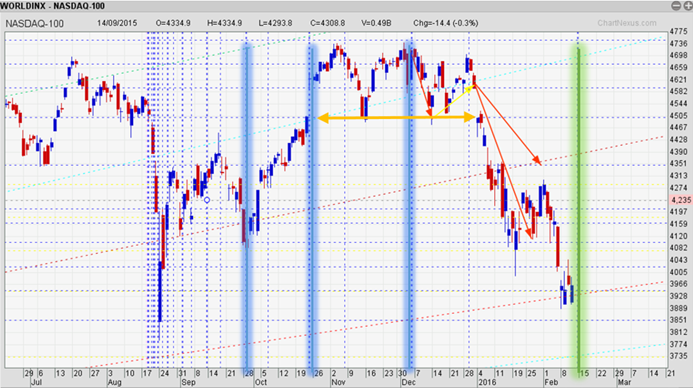 |
| NASDAQ 100, updated to Feb 11th Data Source: Chartnexus |
At the turn of the year, the second leg of the descent starts: I had two scenarios in mind, a long and deep or a more shallow one, both reaching a low around January 20-25. As it happened, the steeper projection came to pass. The low of this leg came in at exactly one level BELOW the Fibonacci retracement level I marked, thereby still adhering to the Fibonacci relationship. Clearly, with the momentum so strong, targets were briefly exceeded. The date for the low is out by just a couple of trading days.
Finally, the green vertical, last Fibonacci time line marks the likely NEXT turnaround in the index. The date: 15 February 2016. Already, the European indices are all turning up some 2% (Friday, February 12, 15:00, Berlin time)
Fibonacci Ratios
The importance of retracements, time extensions and fans cannot be overstated. It allows me to correctly name targets for bullish and bearish moves, particular time zones as well as the turn of direction with superb accuracy. It is not the only indicator range I use, but it is the most satisfying and enjoyable one. I could go into much more detail than I did with the NASDAQ-100, but for many readers this would be too boring. Nonetheless, the level of insight it provides is uncanny.
Here are a few more examples about the achieved accuracy of prediction:
The German DAX was running particularly close to projections and Fibonacci relationships dominate the pattern. The green, yellow glowing diagonal lines are Fibonacci fan lines drawn from the mid-September 2011 low. This fan has been respected throughout the rally since then and - as you can see - neatly separates the bullish from the bearish pattern after the break in August 2015. Its lines represent resistance and support.
The blue glowing vertical lines are two Fibonacci time lines again, though this series starts at the peak in July 2015. The low at the end of September is a close match and the eventual peak on November 2, is coming in a few days 'late'. We are now just 1 trading day away from a prospective turn-day, and as I said above, markets are already moving up.
The orange and blue horizontal lines are Fibonacci retracements and again, they act as support and resistance, and prices frequently respect those.
One I got wrong: I had been way to sanguine about how big the correction would become is - Mainland China stocks. Did not its index suffer the biggest drawdown of all large countries globally, last summer?
But what use is this information to us non-qualified foreign investors, who can't buy into that market, - yet.
GERMAN DAX
 |
| DAX, Oct '15 - Jan '16, along projected outline. Data Source: Chartnexus |
 |
| DAX Jun '15 - Feb 11, 2016 Data Source: Chartnexus |
The blue glowing vertical lines are two Fibonacci time lines again, though this series starts at the peak in July 2015. The low at the end of September is a close match and the eventual peak on November 2, is coming in a few days 'late'. We are now just 1 trading day away from a prospective turn-day, and as I said above, markets are already moving up.
The orange and blue horizontal lines are Fibonacci retracements and again, they act as support and resistance, and prices frequently respect those.
More...
Want to see which other markets I forecasted correctly? - And which ones I did not? Then just write or comment.One I got wrong: I had been way to sanguine about how big the correction would become is - Mainland China stocks. Did not its index suffer the biggest drawdown of all large countries globally, last summer?
But what use is this information to us non-qualified foreign investors, who can't buy into that market, - yet.
Whereto for the Markets?
I think the downside pressure is over, and all that is needed now is for punters to find the feet and go and start buying again. I expect markets to rally globally for some 3-4 weeks (probably no more...), starting in Europe today. As the volatility levels remain elevated, I do expect to encounter quite a few strong up-days, just as we have seen triple digit down-days in the last 6 weeks.


Comments