The Eternal Bull Run Or....
STOCKS RUNNING OUT OF STEAM...
Investors keep telling me that their portfolios did not perform, while markets seem to have run up to new highs month after month. Is that a fair assessment?Just a reminder to the reader: My investment strategy is medium term say 3-6 months, i.e. short term (days or less) consideration are really only important to me when I look to make changes to a portfolio. Anything said in this blog, be it outlook or forecast does not refer to tomorrow or end of the week. I only talk about the next 6-12 weeks' financial market probabilities and how I intend to trade. For more on my strategy please go to this page.
Global Indices
To check what happened over the last 12 months or more, I'd like you to take a look at the sample charts from the US, Europe and Asia in their respective currencies.
US indices
 |
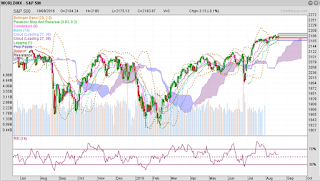
| S&P 500, 1-year view, 2 major corrective moves; source: chartnexus |
S&P500:
The large caps were favourites for many years but in the last 12 months, US indices for this asset class suffered two major setbacks, first in August-September 2015 and second early in 2016, culminating in a trough on February 11. The August 2015 high was topped only in July this year.
The large caps were favourites for many years but in the last 12 months, US indices for this asset class suffered two major setbacks, first in August-September 2015 and second early in 2016, culminating in a trough on February 11. The August 2015 high was topped only in July this year.
 |
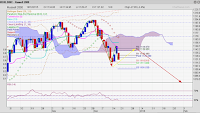
| NASDAQ100, 1-year view; source: chartnexus |
Europe
 |
| FTSE 100, 2 year view, a long winded correction. Still in negative territory after 2 years, source: chartnexus |
 |
| DAX30, 2 year view, still mired in a down trend? source: chartnexus |
Since then, progress has been sluggish. Only the last few weeks after the BREXIT suggest a little extra momentum to the upside. In the current environment, this, too, might succumb to selling pressure sooner rather than later. Prove of that is in a falling RSI, which does not confirm last week's new high.
Asia
 |
| HANG SENG 1 year + view, |
While there has been an upswing since the low in January and February, it was muted. The RSI is also sloping downward, not confirming the recent high of August 15. Does that this look like a market that is going to rally soon?
 |
| NIKKEI 225, during the ABE presidency, 2013-2016, Source: chartnexus |
Hopes were high when Shinzo Abe became president in November 2013 (see blue arrow up). The NIKKEI became a top performer, though the YEN lost 30% of its value. Since August last year, the trend reversed (see red arrow down) and today, the NIKKEI is at about the same levels as it was in October 2013! This is yet another market, where few will have made money over the last 12 month. And there are no technical signals to suggest that this market is going to change direction soon.
Add more indices to the list? Don't be surprised if the picture remains the same: The only major financial markets, which performed positively in the last two years - at least in USD terms -, are the US stock markets. Oh yes, and bonds, too, global bonds actually. Ah - yes, they are in one humongous bubble. It will probably burst when interest rates start rising. Till then, we are quite happy investing in this asset class. As for the rest of the world's equities, we have no real appetite for the moment. There is one other asset class which we like and that is commodities and precious metals in particular. More about that in a later blog post.
Six Months Forget-Me-Not
It's been said that our brains (scientifically unconfirmed...) hold bad memories (like bad market turns, political mistakes, bad nights out) no longer than SIX MONTHS in our conscious mind - obviously to make room for more unsavoury news. Losses in one's own portfolio, however, even the small ones, hurt us more than a stock market crash and its memories last much longer.In other words, it is plausible that many investors, especially in Asia and Europe, only see the rise in US indices since February, and forgot what happened before, - and ignoring the mixed results of their local stock markets. By 'many investors' I mean those I had a chance to talk to or who wrote to me. And those investors predominantly invest in investment funds in EUR or SGD and not USD.
Trading Realities
Today I thought of highlighting a few trading realities that come with investing in different jurisdictions.Currencies
HEDGE OR NOT TO HEDGE...
 |
| USD movements against major currencies over 1 year, source:chartnexus "SWING LOW -11% and RALLY +7%" in just 9 mths. |
A real trading exercise:
Our portfolio is in Singapore dollars.
When we buy a Japan fund, we face the exchange rate fluctuation between SGD and YEN, on top of the market risks posed by Japanese stocks and bonds. The YEN tends to weaken (and the JCB would see this as a success of its strategy) when global equity markets rise, and of course the NIKKEI 225. A fund manager will hedge against a falling YEN and thus preserve the full profits to be had from NIKKEI rally. We are ok with that. However, when the YEN strengthens, the NIKKEI often corrects. Hedging the YEN now, means foregoing the benefit of its strength (=softening the blow of falling asset prices) and suffering the full losses of the underlying assets in the index drawdown.
Tactical hedges in funds could be the answer, i.e. hedge when the other currency does tank but remove the hedge when it strengthens. But many fund houses are reluctant: It costs money and requires special skills, an extra team of full time researchers. Alas, in many funds, currency hedging is practised NOT to increase the profit, but lower the risks. I prefer to work without the hedge (though it is sometimes hard to get away from), and have learned to minimise risks cheaper and more effectively through asset allocation.
EUR / USD
Let's see how the EUR/USD pair interacts with a US index like the S&P 500. In the chart below the currency pair is shown in the light blue candlestick pattern and the index (in USD) is shown by the thin green line.
The most important aspect to note here is the persistent INVERSE correlation (see blue and green arrows):
Blue arrows for a currency top.
Green arrows for a peak in the index.
 |
| S&P 500 in USD compared with the EUR/USD currency pair; source: Yahoo Finance! |
Blue arrows for a currency top.
Green arrows for a peak in the index.
- Almost every time the currency pair peaks, the index records a low.
- Every time the index hits a high, the currency pair is at a low.
S&P 500 for EUR investors
THIS IS HOW THE S&P 500 LOOKS LIKE FROM THE POINT OF A EURO INVESTOR: |
| S&P 500 in EUR terms; source QANDA |
The HIGHS in the index (marked with the orange boxes) don't appear at the same time or in the same way as in the USD chart.
2015:
In Euro terms, the first peak came July 20, at 1964.
In USD, it was on May 21, at 2132.
For the EUR, the second peak was on December 1, at 1984, a new high!
In USD, the index marks only a secondary peak at 2116 on November 3rd, one month earlier! By December 4, the index peaks also, but lower still, at 2094. In other words, between September and December, the EUR investor benefitted from a US stock market rally and a strengthening USD.
2016
YTD, there is only one significant peak in the S&P 500. For EUR investors, it's on July 22, at 1981, NOT QUITE taking out the previous high in December 2015. In USD terms, the index scores a new high on Aug 15, at 2193.
YTD, there is only one significant peak in the S&P 500. For EUR investors, it's on July 22, at 1981, NOT QUITE taking out the previous high in December 2015. In USD terms, the index scores a new high on Aug 15, at 2193.
Here a table of the S&P 500, viewed from the perspective of the USD, EUR and SGD investor, with details of the turning points, levels and percentage changes.
A few interesting facts:
- The low points fall on the same date or only a few days apart.
- The highs can differ by several month.
- The rally gains mirror the respective drawdown, almost all the losses are recovered in the rallies that followed.
- The drawdowns and subsequent rallies are huge, - as are the changes in percentage terms.
- Each time, recoveries are nearly 100%. even a bit more in USD terms during the rally after February.
- It would have been pointless to listen to those who assess and comment only on the US or European markets, but ignore Asia and currency fluctuations.
- As a US investor you could have sold in May... but could have also bought the index fund in SGD to gain the extra few % points!
- For maximum profit, it would have made sense to gauge, which currency to choose when buying the US index, both for going short and long the subsequent rebound.
REALITY CHECK - How did your fund perform?
Singapore Registered Investment funds for the US equity market
 |
| US funds since August 2015 to August 2016; source: fundsupermart Singapore |
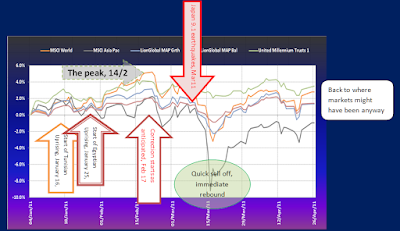
The red line is the S&P 500, this time in SGD terms. Over the year the index posts <1% gain. Three of the funds performed a little better, though < 5%. Three funds underperformed by between -2% to -7%. I am sure you can find many other funds with higher and lower performances but that is not the point I wanted to make.
The 3 that outperformed focus on large and mega cap stocks, as well as dividend paying stocks. Only 1 of them hedges the underlying performance back to Singapore dollars.
The 3 that underperformed did not hedge (remember: the USD gained in strength since February); one of them invests in mid and small cap stocks, an asset class that underperformed the large cap indices.
The 3 that underperformed did not hedge (remember: the USD gained in strength since February); one of them invests in mid and small cap stocks, an asset class that underperformed the large cap indices.
With A little bit of timing,...
Putting on the hat of the Asset Allocator again: In our portfolios, we switched to safety in August 2015, and gingerly re-entered the equity markets before October 2015, again switching 100% to safety early in December. That way, we avoided losses of these major drawdowns in August 2015, January and February of this year. Click here for more details on how we manage our model.
An Incomplete Exercise
You could do the same exercise we have done for S&P 500, with the DAX 30, the FTSE 100, Nikkei 225, Hang Seng, STI etc. - the outcome and conclusion will be pretty similar:
- global markets remain out of sync, if only for the currency war, battling over who wins the most favour, but there are
- the US FED, which don't want to upset the economic apple cart, - not before the election;
- the JCB, seeking economic control and progress for Japan;
- the ECB, "we will do everything necessary...", and the EU, which looks shaken by the BREXIT and yet unspecifiable consequences, and stunned by the refugee problems;
- China, hoping for a break with its languishing stock market performances, applying a stealth QE for its banks and utility companies, hardly ever mentioned in the press.
That's it for today. Wishing you happy, profitable trades.
Want to know more about our strategy and what we can do for our subscribers, just write to info@investimely.com.


Comments