Posts

IMPULSIVE AUGUST MARKETS - The S&P 500
Image
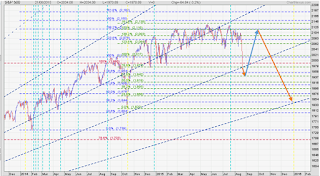
We are in a "corrective market", so goes the headline. Since last Monday, the S&P 500 fell from 2103 to 1971. That is a 6.3% drop in the space of 5 trading days, the largest since - October 2014.  Indeed, the impulsiveness of the correction mirrors events of last October.  Of course, the media argues 24/7 as to when the correction started and why. Was it the devaluation of the Yuan? Events in Greece? The commodity slump? A nightmare vision of Trump as President of the USA? In reality, once the selling starts, many punters ignore individual signals of their local markets, economic divergence or individual risk considerations.  They just get out. But just what do you do, if you are still invested? And if you are out, when do you get back in?  The Greece debt crisis is not over yet: the country is going to the polls - and might end up totally rejecting the tough measures of the recent accord. That would then become a trigger for much greater volatility,and ...

2015 - Second Half Outlook - EUROPE - Part One - GREECE

Image
Europe is not just a union of states. Within it, there is the EU Zone, consisting of those countries who use the common currency, the EUR. Then there is the second tier, countries that aspire to join the EU Zone and enjoy its benefits. But there is third group, which so far consider it more advantageous to stay away from the EU Zone. Often commentators do not distinguish when they comment on "Europe". While the main comments in this report focus on the EU Zone, I want to comment on other European countries, too. PART ONE -  GREECE   The Hottest Topic  Despite its "minimal" economic relevance, Greece is today's hottest topic. Historically, she is the cradle of European culture, philosophy, the birthplace of democracy, and medical knowledge. But today's Europeans often describe Greeks as lazy, disorganised, living a dolce vitae without a care for the world. I don't know many Greeks and I loathe judgemental stereotypes, so I can't really argu...

Currencies at War

Image
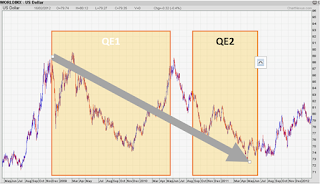
How did it start? 2014 and 2015 have seen huge swings in currency markets and many wonder why the sudden increase in volatility? You probably know the factors that are driving currency markets potty:  The GFC of 2008 was to be cured by quantitative easing (QE), massive injections of liquidity to support world economies. They survived but currencies are in turmoil.   Please note: all charts are made with Chartnexus data and software. USD devalues 30% during QE1 & QE2 During the QE program of the US, the USD purchasing power declined roughly 30% against major world currencies. Thus, the US export industry enjoyed a considerable price advantage, which contributed to the overall economic recovery and the US stock markets.  USD during QE3 etc. to end of QE During the QE measures that followed, the USD stayed low. Only once the FED started TAPERING, i.e reduce the amount of bond purchases in February 2013 and eventually stop purchases altogether in October ...

2015, Mid-Year Market Outlook- USA

Image
Last update: July 12, 2015 USA Economic Health Realities Beginning of 2015, the Federal Reserve (FED) had been expecting continued economic growth. But there was still no decision on the timing of an interest rate increase, which would be a first stop towards “normalisation” of monetary policies. The accommodative monetary policy has kept the purchasing power of its currency in a state of prolonged weakness for over six years.  Over 2014 and 2015, the USD regained much of its strength and position as the most sought after currency . As a result, imports have become cheaper, the risk of inflation stays very low, and the country experiences a large inflow of foreign investment.  Meanwhile the US recovery remains very much on track, helped by low oil prices – and America’s ability to make a success at “fracking”, which reduced its dependency on oil imports, though not necessarily its dependency on oil. Since unemployment fell below 6%, tensions among inve...

2015, Mid-Year Market Outlook - JAPAN

Image
For two decades, Japan suffered deflation, stock market stagnation and exorbitantly high debts. Deflation meant that investors did not invest, savers did not save and companies invested anywhere else but in Japan.  That all ended in December 2012 when Shinzo Abe got a second chance at the helm of Japan's government  He initiated ground breaking reforms, which became known as ABENOMICS, focusing on how business is done in Japan.  Winning December’s snap election has added power to the PM‘s reforms, resetting values for its business and social culture, and pulling the country out of its deflationary cycle. The Central Bank of Japan, BoJ, launches an unprecedented program of vital liquidity, which rapidly weakens the YEN. Corporate earnings (locally and internationally) are growing in leaps and bounds and are now strong enough to put pressure on wages. That has initiated a round of inflation to finally heave Japan away from the threat of i...

2015, Mid-Year Market Outlook - INDIA

Image
PART FOUR Market Drivers: In-depth View INDIA Realities: India's Economic Health As a general comment we can say, Indian economic health has vastly improved and promises more for the next 5 to 10 years.  In 2013, still under the ‘old’ coalition government, the economy had run out of steam, just in the same way that the government had run out of ideas as to how to improve it.  Likewise, Indian stock markets had underperformed.  By early, 2014, the economy struggled keeping the pace. Change was in the air. With a general election looming, punters started to bet on the prospect of a new government and India’s stocks entered a strong recovery phase, despite global headwinds and in stark contrast to other BRIC nations, Brazil, Russia and China. Falling oil prices and inflation below 6% helped a more independent Reserve Bank of India (RBI) cut interest rates. This was well received by the markets, ...