Posts

Showing posts from August, 2010

A Contrarian View - Still A Chance for More Upside?
Image
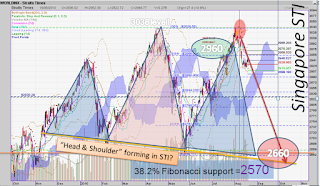
Weekly Updates is what I promised but this week there are no really new insights into the current short term outlook.  This blog has started to take off, getting hits from Australia to Poland, Israel to Canada. It will be interesting where it takes us.  However, this is always only going to be the Menu , not the actual Dish.  To get a real taste and nourish your portfolio, you need to seek the help of the author, or any investment advisor of SingCapital. In a talk I gave last Friday, I showed the chart for the STI , complete with the outline of a head and shoulder formation - and the arrow along the side of the right shoulder pointing toward a potentially dramatic downturn into October and November.  I have never experienced an entire audience GASP! This is the graph:  Indeed, it shows the drama that seems to unfold. Head & Shoulders typically are a 'topping formation', indicating that a major top is in. Some parameters to take note: The crucial c...
-2.5% DOWN IN THE US LAST NIGHT!

Image
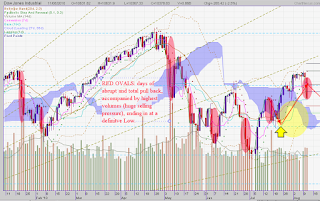
I don't like the big boys' tactics of late!  Rather than cleverly and selectively working with the markets as was the habit during the 'good times' they now have developed a technique (?) of DUMPING, dropping assets in large quantities within a few minutes.  Last night was the NOT the first time as you can see from the graph. DJIA Big Selling Days The 'drawback' of this technique is that all the hot air is out and the oversold signs neutralised within a very short time.  It hardly allows the 'rest' of us enough time to adjust to the new environment.  This dumping technique distorts time frames, compressing an otherwise orderly move into a few moments of mayhem followed by a somewhat chaotic vacuum when trades become directionless and - traders confused or resigned to inaction.  DJIA Daily Chart, August 11, 2010 Sometimes, the tension before such a 'dump' is palpable and one 'senses' the imminent change. When that happens we n...

REVISITNG THE DJIA FORECAST FROM JULY 16th, 2010

Image
Remember this chart? I first posted the chart on July 16th.  That time we had just pierced into the Ichimoku cloud and I had stated that this is the start of a pull back after which a serious summer would start.   My  original outline for the move from then till sometime in September is still in the graph (red arrows).  I also put a fat yellow arrow where I expected the pull back to stop - and reverse.  The lowest point indicated was indeed met, - just a little earlier than I had indicated.   The actual rally took the more difficult route, through the cloud instead of alongside it.  The first peak hit the level exactly as suggested in the previous blog.  It then corrected for a few days and then started to go higher, now exceeding the highs we had pointed to.  While not entirely unexpected, the extended rally suggest that the pull back after 13th August could become more volatile than outlined.  It also suggests that the...

"China' - Not Just Pretty Pictures". A slide show from July 30th, 2010

Image
Prepared for presentation on July 30th, 2010. For a larger view please click on the slides. PAUL, the Octopus, has retired from soccer mania but - 9 brains to entertain children?  Some spare capacity is to be expected.  Recent communication with him revealed that he is tipping for China to pull the world out of trouble.  "Mussels are in the mail,buddy!" Positive returns for most global markets, except two, China - and Greece.  We are not concerning us with the latter but want to explore why the Chinese Mainland bourses have not stopped correcting since August last year. A market that is closed to foreign direct investment reflects more closely what is happening "on the ground". The measures to control a potential overheating have been outlined and chewed over in the media often enough. Once the foreign component is added (overlay of Hang Seng in Hong Kong, below the SSE graph) the picture changes and the sentiments of foreign market partici...