-2.5% DOWN IN THE US LAST NIGHT!
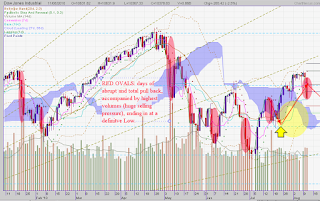
I don't like the big boys' tactics of late! Rather than cleverly and selectively working with the markets as was the habit during the 'good times' they now have developed a technique (?) of DUMPING, dropping assets in large quantities within a few minutes. Last night was the NOT the first time as you can see from the graph.
The 'drawback' of this technique is that all the hot air is out and the oversold signs neutralised within a very short time. It hardly allows the 'rest' of us enough time to adjust to the new environment. This dumping technique distorts time frames, compressing an otherwise orderly move into a few moments of mayhem followed by a somewhat chaotic vacuum when trades become directionless and - traders confused or resigned to inaction.
Sometimes, the tension before such a 'dump' is palpable and one 'senses' the imminent change. When that happens we need to keep our wits together and balance that feeling of an ensuing calamity with the 'bigger picture' before jumping to conclusions. Yesterday, (I believe) was such a day.
The Daily Chart (left) shows what happened at the opening: big gap down accompanied by huge volumes. First support level was the 'round' figure of 10400, then the more relevant 10368 at which point buying volumes increased again, dramatically. A rebound from this level is almost pre-programmed.
I had that sinking feeling on Monday already, - when shops in Singapore were closed for the National Day celebrations.
Such a set up is indicative of imminent trend changes. However, in assessing its potential impact on your portfolio, the important thing to remember is in which currency are you thinking and - investing!
This is what happened in the run up to the turning period:
Conclusion:
With that one-day downward tumble, US markets simply fell in line - again, with the rest of the global markets. From a Singapore Dollar investor point of view, the losses in overseas stocks have been diluted by a softer SGD, by almost the same amount that the US markets lost on the day.
You could say, we are back to Square One, - the original scenario, which assumes that markets will try and rally into Friday, August 13, before finally giving way to much greater downward pressure next week.
We shall see. For the enthusiast, there are some pointers as to the possible path the indices might take (see graphs), but it is kept deliberately vague at this point.
FINALLY, JUST GET OUT OF EQUITY, GOLD AND COMMODITIES, WHILE YOU STILL FEEL GOOD ABOUT IT.
 |
| DJIA Big Selling Days |
 |
| DJIA Daily Chart, August 11, 2010 |
Sometimes, the tension before such a 'dump' is palpable and one 'senses' the imminent change. When that happens we need to keep our wits together and balance that feeling of an ensuing calamity with the 'bigger picture' before jumping to conclusions. Yesterday, (I believe) was such a day.
The Daily Chart (left) shows what happened at the opening: big gap down accompanied by huge volumes. First support level was the 'round' figure of 10400, then the more relevant 10368 at which point buying volumes increased again, dramatically. A rebound from this level is almost pre-programmed.
I had that sinking feeling on Monday already, - when shops in Singapore were closed for the National Day celebrations.
- the SGD / USD ratio had peaked and started to favour a stronger USD in the near term.
- Gold prices pierced ones again through the 1200 USD p/ounce.
- Bond prices surged, having been in limbo for a week.
Such a set up is indicative of imminent trend changes. However, in assessing its potential impact on your portfolio, the important thing to remember is in which currency are you thinking and - investing!
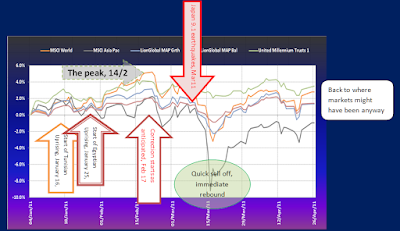
This is what happened in the run up to the turning period:
- Asian stocks saw a peak last week and Monday, August 9th, before pulling back about -2% (Hang Seng) , -4% (STI) at a time when the US capital markets were still powering ahead.
- the Singapore dollar weakened against the USD by -2% within 2 days
 |
| The DJIA graph, again updated with the latest moves |
Conclusion:
With that one-day downward tumble, US markets simply fell in line - again, with the rest of the global markets. From a Singapore Dollar investor point of view, the losses in overseas stocks have been diluted by a softer SGD, by almost the same amount that the US markets lost on the day.
 |
| HANG SENG and the short term outlook |
We shall see. For the enthusiast, there are some pointers as to the possible path the indices might take (see graphs), but it is kept deliberately vague at this point.
FINALLY, JUST GET OUT OF EQUITY, GOLD AND COMMODITIES, WHILE YOU STILL FEEL GOOD ABOUT IT.
For a better view of the graphs, simply click on it to enlarge.
 |
The STI and how it could move till September (left): The Pivot Points (coloured lines at end of graph) indicate short-term support and resistance. The Key Fibonacci level 3038 was the 'Open" price on August 2nd, immediately followed by the most recent correction. Ideally , the index should not go below 61.8% Fibonacci retracement line (see blue horizontal lines). Less favourable outcome would be to touch down on, - or worse - break through the Ichimoku Cloud. No guarantees for after September: A calculated guess would favour the 50% Fibonacci retracement line (2838). Below that the May '10 (2650, worst case).


Comments