It's the T'ursday Turn, for sure!
Today is a down-day, with red figures in all indices, - a typical Thursday Turn day. You can check, among all the days in a week, Thursday produces the most trend turns...Recognising oncoming change, where most do not...
Many took my advice in early August and took profit. Sentiments at the time were ambivalent, but not necessarily bearish. So, some stayed the course. Sudden downward pressure in the third week of August caused anguish among these brave investors. But, at the time (August 22nd), I told you to watch out for an upturn when everyone else was ready to throw the towel. Not following the advice would have meant missing out on the 4-6% upside that followed.
Today I want to tell you that it ain't worth hanging in there anymore, when really the media machine is telling you to throw your worries in the wind. Sure, the recent renewed upside looks nice (at least to those who only look to the tip of their noses), and - after a few days of 'dithering' in the coming days - we might see some exasperating moves till the end of the month.
WE TOOK PROFIT!
For portfolios under my direct care, we have taken profit on September 3rd & 6th, and are now sitting on the sidelines. The reason for our early departure from equities was that the risk versus reward ratio has become unfavourable and - unprofitable. A step like this depends very much on your investment strategy. It has less to do with events in capital markets and more with a medium term view on the one hand - and investment objectives on the other. Taking profit at pivotal points is crucial and more often than not - beneficial to the long-term portfolio performance.
Why would I call for change right now in the face of so much positive news?
- Currencies have become the main target for big investors again, i.e. strong trading volumes and large volatility swings in this asset class are driving analysts potty. A few examples: Beginning of August the € was valued at $1.32, up from $1.19 in June. Since then it fell back to $1.27 and - back up to $1.30. These are huge swings over such short periods. Yesterday, there was even a rare intervention by the Japanese authorities to stop the rise in the Yen. Against this volatile backdrop, the SGD has strengthened 3% since August 8th, or almost 2% since September 6th, too! How is that for a risk-free, very short term return? By comparison, stocks in the STI have only just managed to break out of a tight trading range the index had maintained - since the top in APRIL!
- Capital Markets are all over the place. Small cap stocks are lagging, as is the tech sector, while large caps dictate the pace. It should be the other way round if we are to believe that this rally is sustainable. It means that correlation between indices in various sectors and countries has gone out the window, directional moves are inconclusive and peripheral markets outperform main markets. This is often the DIRECT result of volatile currency pairs playing havoc with valuations. See Japan's Nikkei and the Yen: as the Yen weakens (about -3.3%) so the Nikkei strengthens,+3.5%, leaving valuation +/- 0% from a foreign investor perspective. That really is the key, which locks in the economic misery in Japan. If Japan could only shake off the stranglehold of FDI and carry traders on their currency (and show more bold moves like yesterday's intervention) they might finally come out of the 20-year rut and start competing on a level playing field again. That is an altogether different topic, which deserves your attention, but not via this medium.
- Trading Volumes are minimal. When a market rally is supported by so little volumes, the move is bound to collapse rather sooner than later. See charts below for more details.
- Media would have you that the worse is over, quite the contrary from what the headlines said 3 weeks ago. A concerted emphasis on one outcome only often purports a sudden reversal in the near future. Add to that that market activity only produce short term moves not exceeding 3 weeks, I stick with the contrarian view - and move to the side lines.
Looking back at expectations and checking against reality is a necessary - and sobering exercise. Without it, we lose the perspective of what is really happening - and are instead blown over by the nonsensical wisdom proliferated by the 'experts'. Stock market participants and their views and expectations for the future are the sole yardstick, with which to measure a potential outcome. With over 60%(!) of stock market trades being transacted by computers, the notion of a daily change in sentiment is ludicrous. Most of the moves are 'pre-programmed' and subsequent human decisions are swayed by it for no reason other than herding instincts. As if you did not know...
First up, the STI.
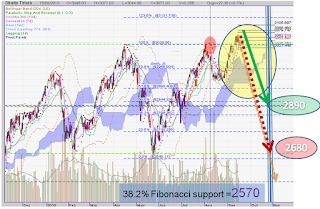
By now you can see that the dreaded head and shoulder formation is well and truly void. We are now in the yellow oval: The index is rising to new highs, - above the previous resistance at 3038. But so far it is simply roaming in "no-man's land", in a range with no significant landmarks below 3100. 3141 would be the ultimate level at this stage. Reaching that during this move seems far fetched, but not impossible.
The period for October still alerts us for some sharp downside, the softest version pointing to a correction of -6-8% (green arrow to 2860), the worst scenario allows for a correction of 12-15% (red / orange arrow to 2680 or even 2570). My preferred view is somewhere in the middle, - about -10% downside.
Next, the DJIA:
We are in the yellow oval, reaching the Fibonacci 61.8% retracement (of previous drawdown in 2008-2009). We are at the time window when a change in direction is expected, as you can see by the arrows I had drawn over 2 months ago. The correction could be mild or more severe, but the July low should hold (orange oval)! That would be my preferred scenario, coupled with a strengthening US dollar - starting after the first week of October. From a SGD perspective, the correction might be limited to -6-8%.
My - currently - more benign outlook for the autumn correction is based on the market activity in China, Australia and Latin America. I maintained throughout that such bullish potential is prevalent and that it could result in an attempt at replicating the autumn 2007 scenario.
But as yet, a full blown replication is still somewhat elusive. Here is the chart for the SSE 180, (Mainland Chinese Stock index): (Click on chart to enlarge)
I have drawn orange arrows of what I expected the outline to be. As of now, directions are in sync, but actual volatility is below par. This is somewhat indifferent and in contrast to good trading volumes, and bullish RSI and MACD indications.
This could be a sign of dithering, or a strategically cautious stance, which would work against a severe autumn correction, i.e. more of a sideways move as I had outlined in my recent slide show about the China (see blog from July 31, 2010)
I told the audience then, that it was a question of 'buying China' every month, August through to November, as a build up to a rally into early next year.
Of course, such a scenario would need to be supported by a positive Hang Seng set up.
So, let's see:
Here a more volatile picture is painted. The swing to the downside in August was more pronounced, but this was compensated by a complete retracement to the August-9th high yesterday (see horizontal dotted blue line, connecting the two peaks).
The first orange trend line was foolishly drawn, did it not assume that the market would fall through the thickest part of the cloud. The dotted orange line now looks a lot more realistic, hitting the thinnest part. The way markets look today, they are as close to projections as one would want.
Nonetheless, here, too, we expect for the market to track down before starting into a year-end rally.
Finally, a look at the AORD (Australian index), because they form part of the bullish alliance between Asia Pacific and Latin America. If there was a chart among these that looks like a sure turn, this one is it! The volumes up are miserably low, and all the indicators are turning decidedly bearish!
In a nutshell:
I wished I could tell you that it's all happening in straight lines. But you know it isn't. While the next few days may tempt investors to fear the worst, they will probably feel baffled by the time we get to the first days of October. Only after October 6th are cycles confirmed in a negative trend. This leaves only a 3-4 week stint for any type of correction, be it mild or sharp and unrelenting. To add to the conundrum momentum may differ in various markets, thus making a distinct prediction rather futile. Take it as it comes, and refrain from going back into the equities too early. There will be a few traps along the way, - probably...


Comments