FED's Bernanke: the economic future ... "unusually uncertain"
"Unusually uncertain" as a description of the current state of the US economy sounds like a bit of an understatement. Are we to believe that
Mr Bernanke does not quite know? Or is confused as to what he should do? Or is he hinting at his government to start looking beyond the propagated 'recovery story' and acknowledge realities? If so, what are these realities?
Depending on the time frame capital markets do tell us more often than not where they are at. And they are in two minds at present. That is not the same as uncertainty!
But it ties in with the longer-term rift appearing between the old and the new economies. More surprisingly, the typical scenario of "America sneezes and the rest of the world gets pneumonia" no longer holds true. The volatility in US and European stock markets - and currencies - was quite exceptional year-to-date. But the dominant driver - high trading volumes - was conspicuous by its absence.
In contrast, Asian indices showed great restraint, even when values elsewhere changed by more than 3% intraday (US markets, gold prices, currencies). But here too, we saw lower than average trading volumes. To me, this is an indication that the few who are invested are reasonably comfortable with their positions while many remain on the sidelines waiting for better risk - reward ratios in the future. This is supported by the continuing inflows into bonds, bunds, treasuries etc. even though interest rates and coupons are as low as never before.
The upward trend accelerated and reached the ultimate peak level of 3038, even exceeded it by some 5 points intraday. Indeed, after a small correction it is rallying again, (see yellow oval) into the portentous time line of Mid-September, 2010! If the momentum continues unabated, the STI could hit 3038 for a triple top and then correct along the green arrow. However, if the next few trading days turn into a sideway or even corrective movement, then valuations will probably follow the dotted red arrow down to about 2680 soon.
I could show you many more indices in Asia and beyond that show similar prospects, neatly separated into two camps, - the ones that will likely succumb to imminent downward pressure and those that are better positioned to continue along recovery lines. But it will probably just bore you.
So here is a word summary (only for equity):
DJIA - neutral to down, expecting downside of about -15% into late autumn;
NASDAQ - down, expected downside some -20%;
Europe - neutral to down, expected downside -8% (buffered by currency);
No markets that I am watching really indicate tangible strength to resist the downward pressure now building up, but - China Mainland stocks, Taiwan and Korea have probably seen their lowest lows for the year and are more likely to turn up at even the slightest relief rally.
Mr Bernanke does not quite know? Or is confused as to what he should do? Or is he hinting at his government to start looking beyond the propagated 'recovery story' and acknowledge realities? If so, what are these realities?
Depending on the time frame capital markets do tell us more often than not where they are at. And they are in two minds at present. That is not the same as uncertainty!
But it ties in with the longer-term rift appearing between the old and the new economies. More surprisingly, the typical scenario of "America sneezes and the rest of the world gets pneumonia" no longer holds true. The volatility in US and European stock markets - and currencies - was quite exceptional year-to-date. But the dominant driver - high trading volumes - was conspicuous by its absence.
In contrast, Asian indices showed great restraint, even when values elsewhere changed by more than 3% intraday (US markets, gold prices, currencies). But here too, we saw lower than average trading volumes. To me, this is an indication that the few who are invested are reasonably comfortable with their positions while many remain on the sidelines waiting for better risk - reward ratios in the future. This is supported by the continuing inflows into bonds, bunds, treasuries etc. even though interest rates and coupons are as low as never before.
"in two minds?"In a nutshell, I would say that
- the "old countries" are facing much stiffer headwinds and have not been able to escape the clutches of the bears as yet, while
- Asian economies in particular are well positioned to enter into a stronger and sustainable recovery phase even NOW.
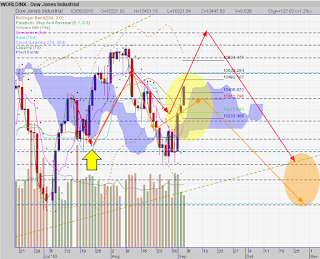
Where to next in the DJIA?Well, the path I originally outlined with the red arrows proved to be right with respect to direction and time, - but the move was much more volatile on the way - and on the way down. It should not come as a surprise that the most recent days proved more boisterous, too. The orange arrows I added on the basis of less bullish parameters, simply because Asian markets do not show the same enthusiasm, despite the better fundamental outlook.
We are now in the yellow oval.
It is make or break time:- Potentially, there is room for one or two days additional upside, BUT the trading volumes have halved since the move began, signaling a lack of buyers at this level.
- Monday is LABOR DAY in the US and its capital markets are closed. As a result, the next trading day would start very close to - or even in - the Ichimoku cloud (see chart), a bearish set up, unless the DJIA opens with a strong gap up on Tuesday, - not impossible but less likely as we approach a significant turning window!
- The odds favour for the present - overall positive - momentum to dissipate by the time US markets open for Tuesday night's trading (Singapore time).
- Time cycles and a range of technical indicators suggest that there is little or no upside left and markets could enter into a more pronounced correction starting middle of next week. The Turning Point refers to September 9th, +/- 2 trading days.
I had my doubts about this H&S formation, as early as July. I stated at the time that if the right shoulder target upside goes beyond 2960, the formation will turn into something else. And so it did!
What about the STI - and the ominous Head & Shoulders formation?
The upward trend accelerated and reached the ultimate peak level of 3038, even exceeded it by some 5 points intraday. Indeed, after a small correction it is rallying again, (see yellow oval) into the portentous time line of Mid-September, 2010! If the momentum continues unabated, the STI could hit 3038 for a triple top and then correct along the green arrow. However, if the next few trading days turn into a sideway or even corrective movement, then valuations will probably follow the dotted red arrow down to about 2680 soon.
Target for the correction: -6% to -8% (valuations only), but this could become -10 to -12% when the Sing Dollar gives up some of its recent strength against the USD.A breakdown below this level and I would have to revisit my forecast assumptions for the remainder of the year and indeed 2011.
I could show you many more indices in Asia and beyond that show similar prospects, neatly separated into two camps, - the ones that will likely succumb to imminent downward pressure and those that are better positioned to continue along recovery lines. But it will probably just bore you.
So here is a word summary (only for equity):
DJIA - neutral to down, expecting downside of about -15% into late autumn;
NASDAQ - down, expected downside some -20%;
Europe - neutral to down, expected downside -8% (buffered by currency);
Singapore STI - neutral to down, expected downside -6%
Hong Kong Hang Seng - down, expected downside -12%
China SSE 180 - neutral to down, expected downside -8%
India Sensex - neutral, expected downside less than -6% (but it has sprung surprises in the past,- nasty ones, especially in March 2009)
Australia AORD - neutral, expected downside -6%, but currency could be more volatile, easily adding another -6% to the losses.
No markets that I am watching really indicate tangible strength to resist the downward pressure now building up, but - China Mainland stocks, Taiwan and Korea have probably seen their lowest lows for the year and are more likely to turn up at even the slightest relief rally.


Comments