Financial Markets Persist In Perverse Volatility
 |
| This nice picture is by Abinesh. Thanks, Abi. |
Happy Deepavali to all my Indian friends and investors. We need those blessed lights ...
Deepavali or not, an investor's work is never done...
Trading at the best of times is a tough task, riddled with unanswered queries, wrong-footed here, a stroke of luck there. But the last 3 months trading was - HELL for many, when doomsday scenarios made the headlines again, just like in 2008. During this phase, the time horizon of investors seems to melt down to hours. minutes even, and longer term investors are just forced onto the sidelines.
The last 10 days' market behaviour followed the same blasted hokipoki pattern (left foot in, right foot out, shake it all about...). Hardly that an upside is achieved, the following day erases it, - and vice versa. What bugs me is that so little thought is given to the consequences, i.e. the damage and uncertainty that such trading behaviour causes with the companies that investors target 'long' or 'short' , fund managers, even dealers and advisors. It impacts negatively on all alike, the good and the bad ones.
HANG SENG
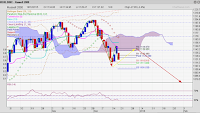
The Hang Seng is the playground of foreign investments into China stocks. The sentiment therefore reflects as much concerns over a Chinese hard landing as it does over the European debacle and short term US interests. What is clear is that a turnaround has occurred early in the month, but the steps up the ladder have been marred by gigantic volatility, reaching 1000 points at times intraday. It therefore signifies that this rally is still struggling with diametrically opposing visions in investors' heads, - and that short term considerations dominate decision making. This is hardly a rally that can be trusted without a plan B, even if the medium term trend has indeed changed.
Having said that, not participating in it seriously undermines an advisor's reputation, at least in the eyes of the growth oriented investors!
 |
| The Hang Seng Flop & Bounce in 8 weeks |
it would take a strong move to break through
- the present resistance of 19000,
- the persistent downward trend line (in red),
- the Ichimoku Cloud (blue filled shape)
- and conquer the 20000 level, which will probably be the highest point achievable in the next 10 days or so.
NASDAQ 100
Tech Stocks remain the fiercest proponents of the bullish case. The index has been leading markets for many of the last 12 months, both up and down. Hence I take heart of the present positive technical picture: If the index breaks through 2448 (=another 4-5 % from today), then the bullish case will be greatly enhanced. But even here, the short term advance potential is restricted by recent peaks at 2440ish and a bearish hook in the RSI, but the momentum actually favours a breakout rather sooner than later.
I am afraid to say, here too, tech oriented funds in Singapore failed to harness the upside of the latest upward thrust.
STI
By contrast, we observe a lot of bearish signals in the Straits Times Index. It embodies the change in outlook of foreign direct investors occuring late last year. They are now focusing on a wider, global field of equities and bonds. Out-of-favour Asia stocks therefore may be suitably priced for a 'buy', but the upside may disappoint going forward, - till at least the end of the year.
For your consideration, a slightly more bullish case can be made for the STI as the previous bullish divergence between the down-trending STI (red arrow) and the rising RSI (blue trend line) preprogrammed the (green arrow) move up. But short-term resistance is facing the index in the Ichimoku cloud (=bullish if it can go through and out of it by early November) and Fibonacci resistance levels at 2880. For the bulls also speaks the fact that our market is somewhat out of the 'limelight', sort of left to its own devices rather than being artifically propped up by short term foreign investment moves. If my assumptions are correct we may see a period of less volatility in the STI, which may not be such a bad thing.
Gold
The final view today is on gold prices. I stick to the prices rather than gold stocks because the latter are a very tricky lot. The chart is an updated version when I advised on the progress of the change in trend in August. Ever since that time, we have invested a good size portion into a gold futures fund. This is now starting to show!
Last night, gold prices again made a big move - against a flat USD, easily crossing into the 1700 range, with a likely target of around 1776. That's when I will take some profit off the table at least. If you are a gold bug, be aware that its relationship to the USD would suggest not to expect TOO much this side of 2011 as the USD is expected the trade range bound.
That's it for today. Happy Hunting, - or better still take a break today, it's not meant for work, just for contemplation.


Comments