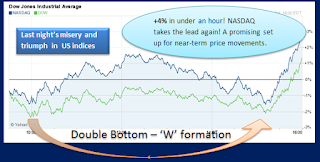
US INDICES: 4% Upside In Last Hour
I am suitably impressed!
(Last night..) 15:00h Wall Street time must have been the DARKEST HOUR in the midst of panic and screams to run for cover. Financial markets had been falling unnervingly for only 3 days, yet sentiment was as disastrous as it was in midst of the chaos of 2008. Telling anyone to stop fretting fell mostly on deaf ears: "He's nuts, he's lost it now!" Those who threw away their assets with no regard to their value will have reason to regret shortly, unless you still have the gumption to do a mental turnaround as swiftly as US equity market traders did.
Intraday
Throughout most of the day, market participants had resigned themselves to be miserable; the opening was 1.5% below the Monday close and the misery almost paralysed price movements. Then, at around 15:00, someone came out of a meeting and said: "I got it!" - referring to lots of money to invest and the absolute conviction of doing the right thing. In the last hour of trading, markets soared around 4%! Not only that, some carry traders came into the fray as well, - showing up in the USD, which started to come down, too. With all traditional parameters back in balance, it turned out to be a great trading day after all.
So, here the question you ask every morning, noon and night: Was that it? What comes next?
Leading the Asia-Pac
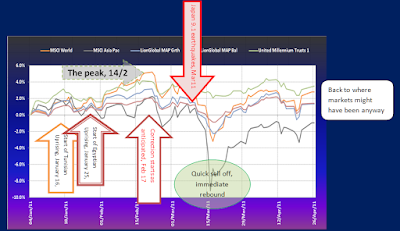
Arguably the 'leading' financial market in Asia is the Australian market, being as closely connected to Asia as it is to Western markets. 'Leading' in this context means giving direction and momentum to the region. I therefore created a quick chart for a client there, to show just what was around the corner. The chart was done yesterday, when everyone was still crying foul! The crying still echoes today.
It is a crowded chart and you might be tempted to ignore it, but bear with me and look at the chart a little more closely: there is a distinct message the markets appear to convey. In a previous blog, I already said that according to markets, QE2 was a whitewash, as at the end of it, valuations came back down to the same levels it started in August 2010. Since then markets have moved 'on' - down - to levels where they even nullify any positive effects of QE1. (see orange arrow: start of the QE1 rally in 2009). Along the same level you see the red bar, which tells you that this is the major support level that must not be broken, for if it does, markets could turn down in a much nastier fashion. Last months' price structure in the AORD shows almost the capitulation of equity investors on the one side, while the underlying momentum indicators show a turnaround in fortunes by trending upward over the last few weeks! That is what makes a bullish divergence x 3.
As it happens the AORD actually held up exceedingly well under yesterday's selling pressure, keenly steering upward from the crucial support level and is up again today following the US impetus.
Many other markets are starting to see similar bullish divergence, but some still display extreme reluctance, among them the Hang Seng. Another party to the bearish camp are high yield bonds, which had a bad run in the second and third quarter of 2011, but have gone from bad to worse in the most recent trading. This development is still of grave concern to me, does it not indicate a fundamental shift away from this asset class by large investors in the face of an expected fallout on the sector as and when the 'haircut' in the European debt crisis takes place, - and Greek bonds (or more) are halved in value. Whether this is the right take on it, is unclear to me. Still looking for better insight and clues. If you want to help me out here, feel free to comment.
TWO OPPOSING CAMPS
These are the two opposing forces in the market today:
- the pragmatic go-getter of equity who sees the current situation as an opportunity, and the bond holders who see jeopardy to befall them sooner rather than later and decide to throw the towel.This jeopardy seems to have descended upon them in the last 3 trading days in particular. Quite what these bond holders think that companies should do, if they are starved of the liquidity upon the return of funds to investors, is beyond me. Some short-term decision to cut losses in this asset class creates mayhem - and opportunity in the future, probably. Admittedly, this asset class may have the longest road to recovery.


Comments