Closing The Books on 2015
The way the markets performed in the last two weeks is even less remarkable than I thought it would be. Over the last few months, I said not to expect too much from the "Santa Rally" in equities this year.
Now, the arguments fly whether this is the start to a January correction, or whether the weakness of the last two trading days is just the market taking a breather and the next rally is just around the corner. Using technical analysis, the shorter-term analysts insist that we will see more upside first, basing it on various indicators, while the medium to long term analysis projects more selling pressure ahead.
Since it is NEW YEAR's EVE today, I only have about an hour before 'my shop' closes and the time comes to switch my attention to family matters, visitors and a bucket full of crackers. I also don't want to bore your first few moments in the NEW YEAR with an analytical essay that may need to be rewritten a week later...
No Change To Tentative Outlook
My convictions have not changed. Here is a repeat of my views for the next 4-6 weeks as highlighted in various posts since October (!):As of January 4, equities, globally, should go 'down', currencies experience more volatility and bonds see a volatile recovery of sorts. Cash (in your home currency) is probably a safer bet, especially if you are risk averse. Don't bank on the USD coming out strongly this month.
What will be interesting to see is whether the end-of-year "window dressing" in mutual funds will have resulted in some last minute positive returns for the month and the Santa rally. What fund houses tend to do is getting rid of assets (a likely contributor to the equity weakness Dec 29/30), which would otherwise drag down the year end performance figures. I want to tell you a bit more about this effect - and what it means to a large majority of investors who rely on advisors and fund managers' skills to build their wealth.
Meanwhile, HAPPY 2016!
A Few Charts To Steer The Way into January
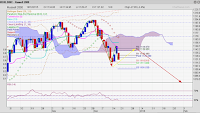
Here are a few charts: The arrows have all been entered early November 2015. Check out my previous posts where I have published the same charts as forecasts. So far, we hit most turning points to the day, - the direction and even most of the levels. |
| RUSSELL 2000, as of Dec 14 Source: Chartnexus |
 |
| RUSSELL 2000, as of Dec 30, 2015 Source: Chartnexus |
 |
| NASDAQ100 as Dec 14; Source: Chartnexus |
 |
| NASDAQ100 as of Dec 30, 2015 Source: Chartnexus |
 |
| NIKKEI225 as of Dec 14; Source: Chartnexus |
 |
| NIKKEI225 as of Dec 30, 2015 Source: Chartnexus |
 |
| FTSE100 as of early Dec, with two options... Source: Chartnexus |
 |
| FTSE100 as of Dec 30, 2015, ...the more volatile path is now a reality. Source: Chartnexus |


Comments