Gold Or Stocks, Which is the Favourite?
GOLD
When mentioning "GOLD", I really mean Gold and Silver. Their fortunes are intertwined and rarely uncorrelated in price. Explaining where we are with gold prices is only half the story. Most people invest in gold via gold funds and gold ETFs. Certificates are easier - and safer - to keep in the house than the actual metal. But first, I want to discuss gold prices.
The last time I talked about this asset class was in May, March, and February of this year. Indeed, it was only in February of this year that it was worth talking about gold after long spell of falling prices lasting 5 years.
 |
| GOLD: a 5 year correction ends in December 2015; Source: BullionVault |
The chart on the left shows gold prices since their high in November 2011. Catching gold at the bottom was our goal by the end of 2015. We started buying in December. After three intakes, we watched and waited.
We accurately identified a significant peak in early May - and took profit. After that we considered our chances to be better with equities - rotated out of gold and into equity funds, after the BREXIT vote! We did not repurchase any gold holdings till the third week of July, only to quickly sell it off again on July 31st. Our most recent gold fund purchase was on August 18. The entry was a tad too early and cost our portfolio considerably: using gold stock funds, we saw prices tumbling by as much as -12% in two weeks, knocking a dent of 3% into our portfolio. Did not like it. In the bigger picture, the step is still "ok", despite the initial drop. I expect gold prices to run up for a while yet. Any drop, near-term, will be a chance to top up on our holdings.
Just to prove my point about the different ways of investing in precious metals, here is a YTD performance chart of Singapore's most prominent precious metal funds:
Gold prices may have gone up some 21% since January 1, 2016 (see blue line), but gold stocks have gone up 100% at the peak a few short weeks ago (red and green line). Even a small change in gold prices creates superlative volatility in gold equity funds.
This is WHY you see so many exits - and entries in our gold strategy this year. I did not bother to invest in the actual gold or silver bar.
 |
| GOLD in 2016: finally making some money again; Source: BullionVault |
Just to prove my point about the different ways of investing in precious metals, here is a YTD performance chart of Singapore's most prominent precious metal funds:
 |
| Some gold equity funds of Singapore jurisdiction; Source: dollarDEX Investments Pte. Ltd. |
This is WHY you see so many exits - and entries in our gold strategy this year. I did not bother to invest in the actual gold or silver bar.
Commodities by comparison have performed below par. Oil prices kept yoyoing and currencies impacted on many commodity prices. We watch the development in that asset class closely as they could be next to perform parabolically.
This is an email I sent out to my investors August 31, regarding Gold:
AN UPDATE FOR PRECIOUS METALS AND SUBSEQUENT ACTION.
Short-term, the 2nd September could prove a turning point but it could also mean another step down from where we are today. The second week of September could weigh in on gold prices, cyclically. I calculated that gold prices to reach $1306, or even fall to 1286 earlier in August. Markets still seem to want to fulfil the pattern, ...may have completed it just this morning, reaching $1308. ...
Follow up Saturday, September 3rd:
...Portfolios lost quite a bit of value as the gold prices dropped in recent weeks. While Friday created some relief for precious metal prices (especially silver), next week could yet see the final pressure point for 2016 ... I said before that prices could still fall to $1286. If it comes to it, this is the perfect week for it.
I suggest the following steps:
1. Hold on to existing exposure (model portfolio exposure is 23% into gold and global resources funds).
2. If gold prices do indeed slump to below $1300, then for our model portfolio I plan to increase gold fund holdings to...more?
3. If gold prices hold at current levels or - start to rise, then I intend to ...more?
YOU WANT TO RECEIVE GOOD IDEAS TIMELY and TRADABLE, (more than just dots), LET ME KNOW, SUBSCRIBE, BECOME A FOLLOWER.
email info@investimely.com
Global Equity Markets
Brief Technical Overview
Firstly, I want to look at markets that have been rallying strongly, and assess what strategy we should consider going forward. Secondly, we look for markets that have been languishing. It is all a bit technical, despite my attempts to keep away from jargon. If you don't want to bother with that, then just scroll down to the summaries, where you will find the salient points for your decision making.
How To Find The Right Trading Moment
I want to highlight a simple method of how to spot the signals which tell us that the market is a) trending, or b) the trend is about to end, using the price index and the RSI (relative strength index). The RSI measures the change in price movements over 14 days. It is also called a momentum indicator.In the following example we are looking at a performance chart of the Korean stock index, KOSPI 200.
 |
| DIVERGENCE: a signal for change. KOSPI 200, since April 2015 - September 3, 2016; source: chartnexus |
DIVERGENCE => TREND REVERSAL
It all changes in the period I marked with a):The green arrow under RSI starts creating higher lows, while prices continue to fall. This is a sure sign that the trend is coming to an end. And indeed it does, at a Fibonacci time zone (black horizontal line). A turn more likely arises when there is a confluence of indicators, like those by Fibonacci. As prices move into period 1, the trend in the prices is up (green arrow), but the RSI starts diverging 3 weeks into the rally (orange arrow), indicating that the trend is about to turn down. In period 2, markets do correct, but again, half-way through the arrows diverge again, the green RSI arrow connects higher lows while prices stoop to yet a lower low and then only turn up. Now in period 3, markets have been rising, while once again the RSI is changing directions to lower highs, thereby leaving higher high in prices UNCONFIRMED. The last price high is augmented by a Fibonacci time line, heralding change. Considering this to be a pivot point, I run the dark red or yellow arrow, to where I think the next move will carry the index. The slant and the length of the arrows indicate the pathway and the time frame toward a first bottom in prices. The (DARK RED) stands for a drastic fall, the (YELLOW) arrow for a more benign outcome.
This is a time-sensitive example, but not everyone trades the KOSPI. Let's look at the more popular indices.
USA indices
 |
| DJIA, DAILY CHART, YTD. a year with several diverging indications;Source: Chartnexus |
The Dow Jones Industrial Average had its yearly low (so far) in February, a major high in July and the final top of 18668 on August 15.
- I used the low in February as my starting point for the Fibonacci time zones (black vertical lines).
- The most recent line marks July 20 as the end to the rally in terms of momentum.
- Since then stock prices have been drifting, but still achieve a higher high in August.
- The RED/GREEN ARROWS should be seen as vertically corresponding pairs.
- The first pair, a GREEN one over the index, a RED one over the RSI, i.e. they diverge in terms of direction. It also tells us, the RSI is no longer confirming the rally in stock prices, the trend is about to change. A few trading weeks later, the index follows the RSI down.
- The second pair, over a much shorter time frame, provides the opposite indication. The green arrow under the RSI says, the second low point is higher, which contradicts the move to lower lows in the index. Soon enough, the markets turn up and - rally.
- The final pair on the left, shows a sideways moving index but a strongly falling RSI. This divergence has been building since mid-July. As yet, markets have not succumbed to the building pressure. However, the divergence is very pronounced and we must therefore anticipate that the turn, when it comes, will be quite sharp, followed up by a downtrend lasting several weeks, months potentially.
- The potential for such a move is indicated with the glowing dark red and yellow arrows, indicating a likely decline and timeline of the drop. The yellow arrow indicates a more benign outcome, and may be the right one for September. But it may not end there.
 |
| S&P 500, 3-month view, source: Chartnexus |
The S&P 500 shows the similar pattern. Indeed, the high in August is more bullish than in the DJIA, but the RSI also shows a persistent downtrend.
Often, volumes are considered as a worthwhile indicator. Poor volumes in the last 6 weeks could suggest a fall in momentum. But August is a holiday period. Therefore a drop in volumes last month is not necessarily an indication of note. However, the sell days are more numerous than the buy days in July and August.
 |
| NASDAQ 100,, diverging RSI,, while prices hit new highs; source: chartnexus |
 |
| RUSSELL 2000, September 2016 divergence; source: chartnexus |
Still, I reckon the index will not escape the selling pressures in September, let alone October. The Fibonacci time line late in November does not mean that prices cannot correct before that. Indeed, it may even provide a time line nearer a low in the markets in this asset class, - and maybe for the general markets, too, if other indices show a similar pattern.
European Indices
 |
| EuroSROXX 50, still lingering in the downtrend, September 2016; source: chartnexus |
The EuroSTOXX 50 seem to be on a different planet altogether. In a downtrend since last year (in pink) the index has as yet to retake the 38.2% Fibonacci retracement level (in pale green), drawn on the total correction till February. Indeed, at BREXIT-time, the index formed a double bottom, and has seen nothing of the spunk of US indices since. As in the other indices, there is clear divergence since July 20, in line with the indices above). Yesterday (DAX and other European indices +2%) may have been a first attempt to gain momentum, maybe as part of the ongoing asset rotation. But the RSI did not confirm the high. The grey circle harbours a confluence of Fibonacci pattern, which requires a major boost of momentum in order to overcome these major resistance levels. It rather looks to me as though that around the time line (September 15) we may see a little exuberance with prices breaching the stranglehold for a few trading days (target 3168?). What happens when the US markets turn and selling pressures build is not difficult to imagine: the index returns back below pink trendline, and into the downtrend, waiting for another chance to break the spell - later this year? I find it really strange to hear reports now that Europe's economies are growing faster than those of the US. It is NOT reflected by the prices in its financial markets.
Asia
Difficult to chose a preeminent index in Asia, as none of them conform with the momentum in US or Europe.
The NIKKEI 225 should be the one to lead the pack, but it isn't. As with Europe, it still only retraced just under 38.2% of the total downtrend, though the RSI supports a further price lift. Maybe I look at that index in more detail after September 15.
 |
| HANG SENG, escaping the long downtrend; Sept. 2016; source: chartnexus |
Time seems to favour Hong Kong's Hang Seng:
The downtrend (in pink) from April last year has clearly been overcome in July this year. The momentum is supported by higher lows in the RSI, closing in on oversold conditions, - but not just yet. Without a Fibonacci time zone to obstruct the rise, and already breaking through the 50% Fibonacci retracement level, the target right now must be the 61.8% retracement, 24755, - possibly by end of next week, when more equity markets may reach fo a peak.
The same questions arise with respect to how will a global selling pressure affect this index? Pulling back to the 38.2% Fibonacci retracement level, maybe? Selling pressure... where would it come from? Realisation that values are out of whack? That hasn't set in in the last 4 years, so why should it now?
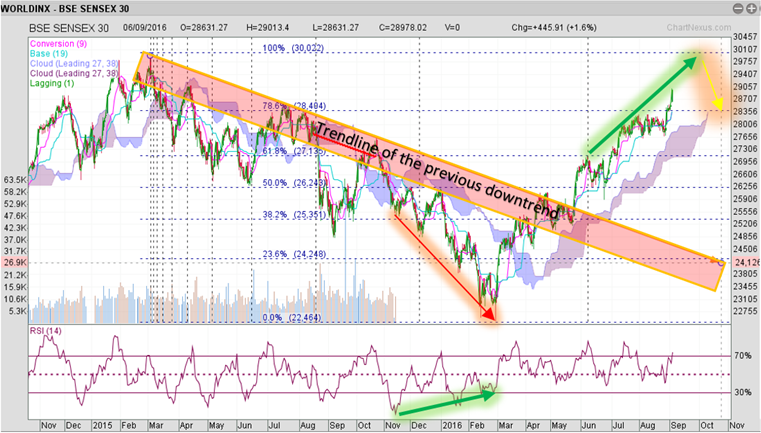 |
| BSE SENSEX 30 in Sept 2016; source: chatnexus |
India's equities are surprising in strength. Last year's downtrend, counting losses of more than 30%, is a thing of the past. It has recovered more than 78.6% of the total drop. Interestingly, the acceleration in the final stage of the downtrend goes against a rising RSI: the signs for a turnaround were distinctly visible.
Since February, the SENSEX added almost 50% gain, and despite my "long-term positive" assessment in July of LAST YEAR, when it came to actual trading, my India allocation was inadequate - and I failed to see the rally to the end. It just goes to show that focusing on the big markets, where - they say - "things are happening", is not necessarily the most profitable strategy. Right now, the index could still race to the 100% retracement line this month - or by early October and then take a little breather.
EXECUTIVE SUMMARY
The long period of complete lack of market synchronisation continues.
USA is on its own path, challenging the notion of market cycles, which must correct at some point. Famous Bond Guru, Bill Gross, reportedly commented on the Federal Reserve's mastery at manipulating the markets. Maybe Masters of manipulation of the US markets or those markets with the biggest impact, or those most visible to the media so as to influence decision makers...
The rest of the world is running at a different pace. Europe's equity markets are beat down to a level when you wonder how much lower it will go. Asia has found new life since February this year. But almost every market is facing the signs of diverging relative strength in the short to medium term. The build-up of selling pressure as measured by the RSI, suggests a medium to severe pullback, which in some markets could last for the remainder of the year.
The most sanguine of investment sentiments are in Asia, presently. It remains to be seen whether this sentiment will last beyond September.
Gold may be the silver lining on the horizon. I, for one, am quite heftily invested in gold and global resources now.
More soon.
Keep it steady.


Comments