OCTOBER TURNS, PART 2
Stock Market Divergences
The curious thing about divergences is they can last for months, sometimes even years before they dissolve and turn into one big market convergence again. As long as one economy, - the US -, is the global leader, a return to correlated markets is what most parties wish for. Divergence occurs - as an exception, when regional economies are running into headwinds - by plan or by chance. Few people are able to predict the exact time of change from divergence to convergence, but - stock market cycles, seasonal behaviour, even statistics can become the proverbial "straw that breaks the camel's back". If we just knew, which one! Therefore, we reluctantly accept that there is no ONE measure tape, which tells us for sure, when a stock market rally comes to an end, BEFORE it happens.
Divergence Pictured:
Over the last 2 years, the divergences in trend between the US stock market and the rest of the world could hardly be any starker:
 |
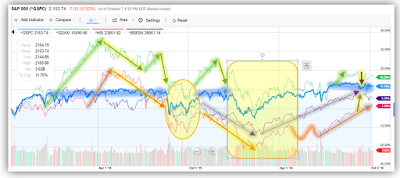
| Source: Yahoo! Finance; 2 year overview of diverging and converging equity indices for US, Europe and Asia x Japan |
The blue line represents the S&P 500. Since October 2014, the index is in a slow and steady uptrend, which was interrupted only in October/ November 2015, and again in January/February 2016. The 2-year return is about 11%, on USD basis. The blue arrows (mostly horizontal) show just how comparatively low the volatility in the index had been.
The DAX, represented by the green line, is much more volatile. The green arrows show how it runs against the trend set by the US. The only periods of greater correlation in terms of direction (but not necessarily in numbers) are indicated by the orange oval (Oct/Nov 2015) and square over January to March 2016.
In March 2015, China's HANG SENG (red line) started a six-week rally, 10 weeks after the DAX rally took off. Indeed, the peak of the DAX is close to the rally start in the Hang Seng. I consider it a case of ASSET ROTATION, i.e. selling one asset at the peak and buy the cheaper one. Indeed, the rotation only favours the Hang Seng, while the other major Asian index, the Indian SENSEX (purple line), keeps consolidating only and, after November 2015 starts a corrective phase into February 2016, in line with the dominant trend.
February marks a major turning point for all indices.
The initial market reaction to the February low is a broad based uptrend till March. Then follows a pause for US, and European equities. China suffers a rollercoaster and - India powers on, still. Following the extraordinary sell-off after the BREXIT vote in June. the global momentum turns positive again. The indices for China, India and Germany show strong correlation for a few short weeks, ending mid-August. Thereafter, China and India continue to rise while the DAX and S&P 500 largely move sideways. The final two little, BLACK glowing arrows on the right of the picture show up a recurring inverse correlation between Asia and Europe and US, may be as a result of active ASSET ROTATION again. But it could also be a sign of yet another trend change for Europe and US at least.
In summary:
The only periods of significant correlation occur during corrections, and the immediately following rebounds. This is important: Correlation between regions creates a much stronger, longer lasting momentum.
When markets will move in sync, the moves will be durable and - hard to stop, by way of intervention. We must therefore be mindful that any increase in momentum in the coming weeks or months will coincide with strong selling pressures. We could be in for a volatile period, lasting longer than just a couple of weeks.
Mutual Fund Performance, 2-years.
To understand the implication of the last two years' diverging performance records in Asia, Europe and the US, here is a sample of Singapore registered funds, invested in the said regions.
 |
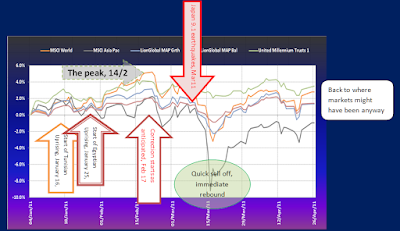
| 4 funds, 4 regions 2 year view; source: fundsupermart Singapore Please do not consider the fund selection a recommendation to invest or buy. |
All funds are shown in SGD. When comparing with the regional index chart above, you will notice the divergence in funds, too (especially the China spike in March 2015), though less striking. The reason? Well, the performance takes currency fluctuation into account. This is especially noticeable in the US fund, which shows a gain of 20% in SGD versus 11% based on S&P 500 in USD. And no, the manager did not outperform the index. He just had the benefit of a strengthening dollar. "Why" you might ask, "is the volatility in the DAX not reflected in the fund performance?" Well, again, it is a currency play: the EUR fell against the SGD from 1.59 to 1.53 over the said period. And it was a volatile ride.
The October Turns, Straight Ahead
In financial astrology, - which effectively is just another form of cyclical assessment as moving planets form intriguing pattern -, this October seems to have a particular sting to it. Mankind have yet to figure out (at least in the western cultures) how such a causal relationship can exist, but we do know that they produce recurring effects on human behaviour and probably a lot more. Connecting the dots in the way they do, I, for one, am paying attention when the warnings signs multiply.
Apart from our habitual apprehension regarding the seasonal downturn in the fall, a very old, US led bull run, and resurfacing problems with banks, Deutsche Bank being the most recent target, any suggestion now by financial astrologers of deteriorating investment conditions should rattle a few extra nerves.
If I understand the implications correctly, major turning points for the equities are coming up just now, next week and even more in the third/fourth October week.
I don't quote such details lightly. But I made it has been my main task for many years to try and avoid downsides when they - in the simulation - exceed certain thresholds. In real trading, I took evasive steps in August last year, in January, - and June this year to name the most recent flash points. Our model portfolio readily shows the actions we took and their impact on the portfolio returns.
Anyway, it will be interesting to see, how much of that will be attributed to the turbulent presidential campaigning in the US. And, of course, betting shops (and fund managers?) having a field day, strategising for any result. Traditionally, once the election result is out, equity markets have rallied. This time again? For how long? And could such a rally survive the implied December interest rate hike by the FED?
It certainly is one adrenalin push too much for many private investors who have long chosen to err on the side of caution. And yet, November could indeed proof a great opportunity, if the markets agree with the choice of president on November 8.
Any comments?


Comments