November Turns 1
Post Election Brief
"Jetzt haben wir den Salad", the Germans say, which translates as, "Now we've got the salad". Trump is president-elect. Family harmonies still ruptur over lunch discussions, as to how the US got itself into hot soup but - like it or not - they will have to eat it.
When opinions become too one-sided before an event, the chances of an unexpected outcome are high, - and I did warn about it just last Monday,
Volatility revisited
 |
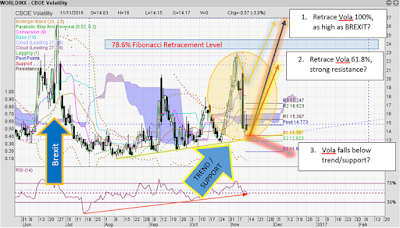
| CBOE BREXIT TO TRUMP, source: chartnexus |
To follow through here the updated chart of the volatility that I talked about before the election.
The pale arrows in the orange oval indicated my expectations. But they were thwarted. Volatility fell far lower, almost touching the trend line drawn from previous lows, thus acting as a support line.
We are at an important juncture time-wise, despite the confusion in the markets. If market participants continue to respond as panicky as they did all last week then it is possible that Scenario 1., a full retracement to the levels during BREXIT, will come into play. Equity markets will then correct by more than 8%. If however, indecision prevails as in Scenario 2., then a return the resistance level of 61.8% Fibonacci is likely, accompanied by a few months of crisscrossing direction changes dragging markets (ALL ASSETS POTENTIALLY) lower, It would create a most frustrating investment time when only short term tactical strategies could perform. Could, not would. Scenario 3. is a possibility in line with historical rallies after a US presidential election, also referred to as the honeymoon period. But this would mean breaking the present trend line, I drew from last low in September. In the current environment, I consider this the most unlikely scenario.
Stock Market Set Up
Most regional markets are in longer term down trends. The blip to a short-term peak in September has not really changed the picture. Question remains, why these markets run down while the US indices have run up? I previously outlined the next moves in equities. Actually, that outline is still valid for most part. | |
|
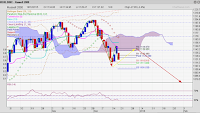
A 3-day chart of US indices + CAT shows up the volatility, not just among indices but also with one of the leading stocks. Especially since Thursday, markets diverge with a strong bearish tinge.
 |
| US indices,3 days to 11-11-2016, source: Yahoo ! Finance |
The 7-day view shows the big diverging move early on Friday. Other indices also diverge, presumably as a result of investors speculating on which policies the new President will pursue first. Some say, healthcare providers will be impacted negatively if he starts dismantling Obamacare.
Some think, deregulation measures for banks may provide a leg up for the financial services industry, and another chance at a bigger bubble! Defense stocks, too, are in the spotlight. No one can yet quite foretell how America's new trading style, its economic and military protection measures will affect financial markets.
In truth, this type of investment strategy is patch work of the weirdest kind, as it disregards how industries are connected to each other, how assets relate and currencies fluctuate. What will set a new direction is a) a decision on interest rates, next month; and b) a possible policy "steal" by Mr Trump to undermine the Federal Reserve. He said, he "don't like HER"...
In truth, this type of investment strategy is patch work of the weirdest kind, as it disregards how industries are connected to each other, how assets relate and currencies fluctuate. What will set a new direction is a) a decision on interest rates, next month; and b) a possible policy "steal" by Mr Trump to undermine the Federal Reserve. He said, he "don't like HER"...
Before that, I expect unruly financial markets, globally.


Comments