Posts

Model Portfolios Update Jan 7th, 2011

Image
Finally, after a few technical hitches we are able to show up our model portfolios again. Of course, the chart is now also back on its extra page in the blog and will be updated regularly. It's a promise. As you can see, our "downtime" in October and November, sticking with a risk averse outlook and - bonds -, resulted in the MSCI World catching up with our conservative portfolio.  Instead of MSCI World, we ought to say US stocks, which were about the only regional index that had a clear run up. The more risk oriented portfolios however, still are well above all benchmark and comparable funds. You probably noted a sizeable correction mid-November.  That is when we have taken a first step back into equity, - and a large portion of high yield bonds.  We had to have patience to see a positive result, but we are slowly getting there.  All portfolios showed positive returns for 2011, and are up since beginning of the year, too.  If you are conscientious in your o...

Gold Prices Ready to Move, - but Whereto?

Image
Just a quick one today, or 'two' I should say. There are still a few tickets for Tuesday, 11 January 2011, at the HDB Hub, where we will present our outlook and strategies for 2011.  If you can come, drop me a line quickly so I can reserve your seat. If you order through me, it's a complimentary ticket, - otherwise it's $30.00 at the door. Gold prices have touched on the 1360 level, which denotes crucial support. If prices now close below 1360 in the next few trading days then we can safely assume that gold is ready to correct down to about 1295, the level I expect to reach sometime in February.  If this happens, we will go ahead and execute the proposed changes as outlined to our investors last week, - and then wait and see what the rest of the market does: If gold does indeed correct now, then the envisaged weakness in currencies this month becomes a non-event.  It might also suggest that bond prices (treasuries and sovereigns) will take a dive, and commodity pric...

HAPPY NEW YEAR - FROHES NEUES JAHR

Image
In my youth, the turn of the years was a "serious" affair.  Indeed, we frowned upon the noise making drunkenness that many fancied.  Instead, a few good friends would gather on New Year's Eve at one of the many ski huts on top of a mountain, devoid of running water, electricity, telephone, TV etc. It was our hideaway from all mundane life for a few glorious hours.  At typically -20 ⁰ C, the air up there is absolutely still, noises muffled by the powdery snow all around us.  A few yards away the steep slope, which will carry us back into the valley later. Virgin snow as far as the eyes can see! A crackling fire, a few simple home-made foods and an evening filled with songs and stories from the old year, while candles and torches shed a magical light into our humble surroundings. The closer we get toward midnight, our thoughts would turn gradually inward, well aware of the milestone we are about to pass and the new road we would need to travel.  As a final ...

"Soft Landing" ahead!

Image
Merry Christmas 2010   As expected by our cyclical research, markets are treading a bit softer over the coming few trading days before a final push into the New Year .  Whether the actual downside pressure will amount to much remains to be seen. I don't see swings of more than -2/-3%.  This softness in the markets will manifest itself different in the various countries and sectors, - which is really what we are seeing in our portfolios at the moment: Gold rallied into $1425  (Dec 6), and is on a slide since. I expect prices to remain above $1360 per ounce. China stocks are having a tough time rallying, and even Indian and Singapore indices are somewhat lackluster.  Currencies continue their rollercoaster moves.  In other words, nothing out of the ordinary for the Christmas season: lower volumes, the annual window dressing exercise by institutional investors, clearing the deck of non-performers and of course early profit taking. Overall our portfolios ...

DJIA – Dancing a Two-Step to Fibonacci Score

Image
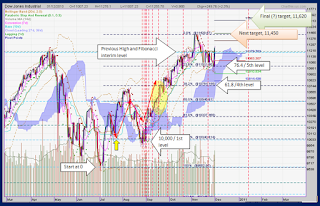
When it comes to Mr Fibonacci, his "levels" are as attractive as Casanova in his heydays, - that is to DJIA investors at least. The chart shows you just how much swing is in the daily steps, hitting the levels as if they were mere rungs on a ladder or musical scores.  Rising through Fibonacci Levels The rally arguably started in July, but you could also take the mid August low as the starting point, after the Dow temporarily broke below 10,000. The recovery was prompt and V-shaped; the rally went on in a grand way since. In October, the index passed the 4th level and then settled between the 5th level and the previous high in April.  November saw it bursting the range and running up to a new high for the year. Solid resistance blocked its path below 11,450. Since then, it fell back to the 5th level again, doing a two-step-up-down move every other day.  This Wednesday, it finally broke out of the narrow trading range, strongly moving toward its next target (mid December)...

All That Noise...

Image
Well, it's inappropriate to placate the Korean skirmishes as "much ado about nothing". But the media's response is certainly over-dramatising it, and inappropriately so, when they claim that yesterday's bloodletting in Asian indices had anything to do with North Korea's desperate call for attention, military style.  The first missiles hit the South Korean island at about 2:30h, with the barrage lasting about one hour. The South Korean index showed almost no reaction at the time and closed almost unchanged on the day of the attack. This morning we notice a knee-jerk in valuations at the opening, only to be completely retraced midday.   Other indices like the STI below, were already on a downward slope, which simply continued without any reference to the trouble in Korea. What many fear now is that trouble keeps escalating, in Korea, with the European PIIGS, or any other misadventures courtesy of QE. What few acknowledge is that we have probably already t...

Global Markets - A few days in the RED - and then?

Image
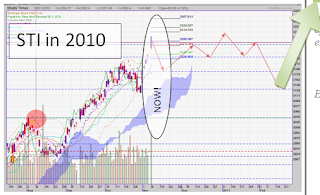
Many times I have outlined views on the main driver of global capital markets, the indices in the US, simply because of their close correlation to stock market affairs in Asia.  Today, I want to comment on issues closer to home.  In our SC Monthly Market Outlook, published in the first week of November, I commented on the STI, drawing a few directional arrows into the topical chart to outline the likely path for the coming weeks.  The STI has already reached  heights of over 3,300. My research suggests that advancing from this level will require another QE because QE2 has extended gains beyond forecasted levels. The chart on the right shows the index right up the announcement of QE2. Respite came promptly in recent days, with a chance for overbought conditions to normalise. On the right is the updated chart including the last few days' action.The sequence of red arrows start on the announcement of QE2 (red triangle). The big orange arrow points to where we are...