Posts

USA - A Day of Reckoning

Image
market snapshot this morning 09:10h Stock markets in the US fell sharply last night.  Especially tech stocks saw a large and ominous sell off. Don't we all know why? It's not the debt ceiling, surely!  They, that is all parties to the process of resetting the ceiling, agree they will HAVE to do it.  Instead, ideological standoffishness and unsavoury arm bending stops law makers from signing on the dotted line.  Should we, the rest of the world. care? Oh, indeed! The USA was and remains at the forefront of the fallout of the financial collapse in 2008.  Do we really expect to start over with a clean slate, just as if nothing significant happened?* just a rhetorical question.. However, the current impasse is not about learning from mistakes, rather how to best manipulate to one's own advantage.  I guess that US grassroot movement now throwing their weight about was named 'tea party' because that sounds the most innocent and removed from its intrinsi...
“Is Gold money?”

Image
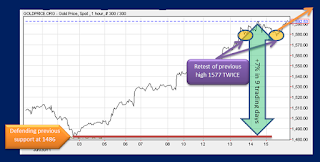
Congressman Paul supposedly posed the question to Ben Bernanke in the US Congress last week about whether "Gold = money:?" " NO " replied Mr. Bernanke, reportedly.  At the same time, he advised that he would be happy to print money for the third round of QE if financial markets need it, - or the economy needs it? Who needs it exactly? Banks? You and me? Gold since early July 2011 Of course his (BB's) answer is CORRECT.  Gold is not money , because money is just a nominal means to pay for the real - or unreal - things we want.  By printing more, we are diluting its value in real terms, while gold has intrinsic value - for as long as humans fancy it.  And fancy they do , big time. Last week, in a huge move from under $1490, gold prices raced to new all-time USD highs of  $1593. In a subsequent pullback last Friday, prices then 'successfully' retested the previous high of 1577/1581 (May 2011) and may now well be on their way past the 1600s range. ...

Latin America - Promising Much, Delivering Little (?) to Long Term Investors

Image
Today, I hope to start a series of regional market observations, exploring whether - in the big scheme of things -  they offer investment opportunities for longer term investors, - and if so, provide some ideas of upside potential and likely strategies. The First Topic: Latin America , and - for the purpose of research - Brazil's BOVESPA, comparing it with mutual funds for Brazil and Latin America as a region.  While in the main we limit ourselves to equity research, I also want to make comparisons with emerging market bonds/ Latin American bonds. To make this a viable exercise for long term investor, we look back some three years, i.e. from August 2008 till now.  This 3-year time frame coincidentally gives us plenty of clues on where we are - and where these regional markets are heading, viewed from a technical analysis perspective. BOVESPA & NASDAQ - There goes the proverbial correlation! This chart has only one message, and it is an important one: Sto...

Financial Markets Are Deceiving Us...

Image
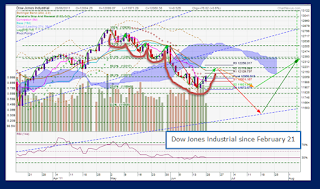
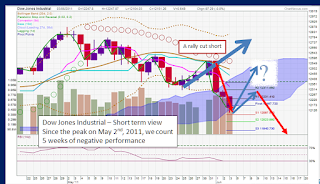
As you can see from the model portfolio activity , we actually made a successful exit in early April and have been sitting on the sidelines for most part.  In the meantime, markets orchestrated one of the most deceiving moves off late, initiating a slowly mounting downside momentum in various forms without resorting to outright downward pressure. DJIA till end of summer 2011 These are the most dangerous of market conditions as we move from day to day, sliding down in small steps ( outline in red) , followed by seemingly contraindicating upsides in other regions of the world mixed with a few days of relief bounce every so often.  It lulls many investor into believing that all's well, there is no cause for alarm.  I BEG TO DIFFER! The current setup in this charts is just one example of many other financial markets, showing that the negative momentum is on the increase with each swing extending further down , - creating lower lows followed by reciprocal rebound actio...

"HEADS or TAILS?" Markets in Contrarian Dilemma

Image
If the likes of Roubini and similar bears have their way, the end has come for any stock market advances for a while: The US congress signals the end of the road for higher debt ceilings. QE 2 monies are up for review in August. Europe's credit crisis deepens, with Greece seeking a second bail out. Europe now at the center of a food scare of some magnitude, a mutated e.coli strand we have no cure for and don't know its origins. Is this a European version of SARS? China stocks still mired in consolidation while its government imposes ever tighter controls on the financial system. The Arab spring could deteriorate into civil wars instead of a ripe harvest of new found self confidence and freedom.  Japan still no closer to a satisfactory outcome of the nuclear reactor crisis - and a rebuilding of the tsunami hit coastal regions.  The list is of course incomplete, inconclusive, and superficial.  There are many more areas of  concern, more troubles brewing and mor...

Two DOWN days create a bear market?

Image
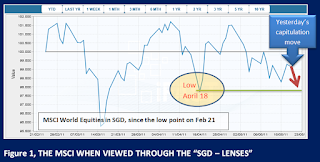
We are at an interesting juncture in the market, - just when short term cyclicals suggest it should arise: Global Equities back to April 18 lows, - finding support? The MSCI World in SGD Markets globally have seen a lot of downward pressure last week, meaning that a lot of sellers came on the market and buyers, although willing to instigate considerable trading volumes initially, did not see it as an outright purchasing opportunity by the time we got to Friday.  Over the weekend sentiment among buyers wilted and come Monday an impulsive rout ensued pushing markets some 2% lower, a little more in tech stocks, less in defensive equities.  The reason I am showing you the MSCI World in SGD terms (instead of a DJIA or S&P500) is to alert you on exactly where you - the SGD investor - are positioned. Avoid being bamboozled by an index chart in any other currency! We are only back to the levels of April 18 and, to all intents and purposes, it looks as though markets could...

Model Portfolio Update, May 12, 2011

Image
Today, I don't just want to show you how well our portfolios are faring, but - tell you about some of the strategic decisions that have contributed to their success. The inception of most portfolios was in October 2009.  The graph clearly demonstrates that portfolio valuations are well above benchmark funds and Asian indices.  The only index that has fared 'better' is the MSCI World index, simply because the US and European indices rallied for much of the second half of 2010, while our portfolios were constrained by my conservative view at the time. portfolios in overview since inception in October 2009 The argument was that while portfolios managed to avoid the sharp correction in April, we also re-engaged in equities as early as mid May and stayed in till September, building up a big 'safety margin' and comfort zone vis-a-vis benchmarks and global equities. I therefore did not see the need to 'push our luck', by leaving allocations unchanged beyond ...