Short Term Market Volatility On The Increase
A few days ago I showed you a chart, which outlines the cyclical momentum now till April based on Henning Schaefer's Cosmotrend. It is now quite likely that reality follows the outline.
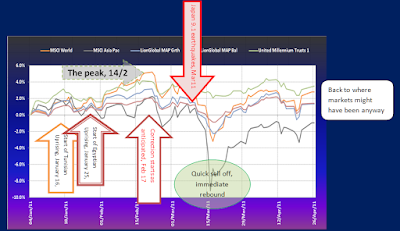
The chart shows
Hence, we should not simply buy into a falling market like today, but wait till early next week, when the effects of the volatile phase should culminate, find a low point and immediately start rallying from there. This kind of market is quite difficult to trade, - and I am glad I have approached this entry with 2 steps already, now targeting one more for early next week. We shall see how we fare, - but so far - not so bad at all, as most of the funds we switched into show positive returns often in excess of 1% (last Friday's price).
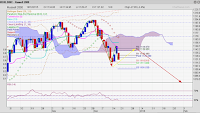
The next chart is a 'follow-through' of the STI chart I did recently:
We seen lower lows than I had forecast. This suggest that the upside now is 'easier' to be had (less downside risk to account for), and even a rally to the previous yearly high of 3300 would deliver nice enough returns. However, if the above cyclical chart, based on the DAX (German Share Index), is anything to go by, this high may not be enough...
The time-line (red vertical line) is of significance, especially since it finds a conspirator in the Fibonacci time scale (green vertical line) in the immediate vicinity. So, end of March will probably an opportune time to check the investment parameters and - gains in the portfolio.
The fact that the WALL OF WORRY is growing again, suggest that professional investors are the main participants in the markets, which typically rise against it.
Happy investing.
The chart shows
- a peak in the markets earlier this week,
- again early next week and
- then a volatile phase immediately thereafter
Hence, we should not simply buy into a falling market like today, but wait till early next week, when the effects of the volatile phase should culminate, find a low point and immediately start rallying from there. This kind of market is quite difficult to trade, - and I am glad I have approached this entry with 2 steps already, now targeting one more for early next week. We shall see how we fare, - but so far - not so bad at all, as most of the funds we switched into show positive returns often in excess of 1% (last Friday's price).
 |
| Singapore shares beating a menacing retreat - only to recover, soon! |
We seen lower lows than I had forecast. This suggest that the upside now is 'easier' to be had (less downside risk to account for), and even a rally to the previous yearly high of 3300 would deliver nice enough returns. However, if the above cyclical chart, based on the DAX (German Share Index), is anything to go by, this high may not be enough...
The time-line (red vertical line) is of significance, especially since it finds a conspirator in the Fibonacci time scale (green vertical line) in the immediate vicinity. So, end of March will probably an opportune time to check the investment parameters and - gains in the portfolio.
The fact that the WALL OF WORRY is growing again, suggest that professional investors are the main participants in the markets, which typically rise against it.
Happy investing.


Comments