Posts

All That Noise...

Image
Well, it's inappropriate to placate the Korean skirmishes as "much ado about nothing". But the media's response is certainly over-dramatising it, and inappropriately so, when they claim that yesterday's bloodletting in Asian indices had anything to do with North Korea's desperate call for attention, military style.  The first missiles hit the South Korean island at about 2:30h, with the barrage lasting about one hour. The South Korean index showed almost no reaction at the time and closed almost unchanged on the day of the attack. This morning we notice a knee-jerk in valuations at the opening, only to be completely retraced midday.   Other indices like the STI below, were already on a downward slope, which simply continued without any reference to the trouble in Korea. What many fear now is that trouble keeps escalating, in Korea, with the European PIIGS, or any other misadventures courtesy of QE. What few acknowledge is that we have probably already t...
Global Markets - A few days in the RED - and then?

Image
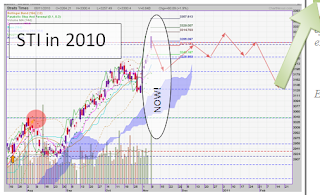
Many times I have outlined views on the main driver of global capital markets, the indices in the US, simply because of their close correlation to stock market affairs in Asia.  Today, I want to comment on issues closer to home.  In our SC Monthly Market Outlook, published in the first week of November, I commented on the STI, drawing a few directional arrows into the topical chart to outline the likely path for the coming weeks.  The STI has already reached  heights of over 3,300. My research suggests that advancing from this level will require another QE because QE2 has extended gains beyond forecasted levels. The chart on the right shows the index right up the announcement of QE2. Respite came promptly in recent days, with a chance for overbought conditions to normalise. On the right is the updated chart including the last few days' action.The sequence of red arrows start on the announcement of QE2 (red triangle). The big orange arrow points to where we are...

POMO - The New Kid On The "Blog"

Image
What is the point of working with technical parameters when they go out of fashion! Today I was introduced to the indicator that throws all others in the bin, potentially: Called POMO - Permanent Open Market Operations , it tells us when the FED goes on a shopping spree in capital markets.  And they even announce when they are buying - and how much there are willing to spend. Word in the Street has it, that on most such occasions, markets turned, often sharply, up. This - now very regular - intervention negates in particular expectations for the downside, i.e. bears are becoming frustratingly sidelined.   The motto: if the sun shines, fine, if it rains, get the FED. Hurray, no more down-days. That is exactly what happened last night, too: we saw Asian and European stocks taking a well deserved breather, - but as soon as the US markets opened - and fell by some 100 points, in the breach they sprint to save the day with a small plus, - good enough to turn the rest of the ...

The FED speaks - and Investor Hearts Miss a Beat!?

Image
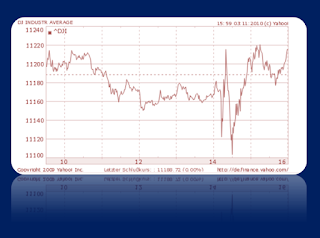
Just a brief interlude for your enjoyment!  The rude awakening may come later... Yesterday, the FED managed to move (index-) mountains,short term:  In the run up to the announcement on the latest QE, a lull was in the market (DJIA 1-day Chart, on the right). Then we see a sudden exhilarating, erratic move, much like on an ECG.  Jolted into action, prices first moved down, then up, down further and finally up, with more emphasis.  Sounds great until we note that actual volatility is less than 1%. It suggests that rather than missing a beat, investor reaction was that of geriatric fingering on the keyboard...  I am not good at dissecting FED messages in search of mystical clues and hidden meanings, so I will refrain to comment on the actual QE proposal.  Most of my readers know by now that I am with the hawks on this.  I am not convinced America can spend itself out of the mess they created, especially when America's investors don't invest in t...

"Inflection Point" in the stock markets

Image
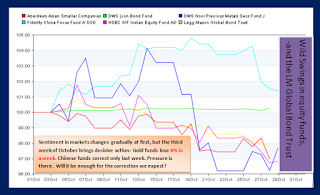
Overview   Short term review If you thought that funds had had a better week than last, this will disappoint you: more than half of our funds recorded negative performances again, with the worst results in bonds of -0.8% and -2% equity funds. Asia is at the forefront of the losses: India, China and Thailand funds. The best fund return we record for this week is just short of 2% (LionGlobal Taiwan), representing a lagging market.  On a monthly basis, -2.5% shows up as the maximum loss. The best monthly returns (only 5 funds above +6%) have been realised in Asian and Latin American funds, which have one main theme in common: Global Resources.   In other words, lowest and highest returns between diversified equity and bond funds are just about 4% apart, much closer together, than the propagated New Bull Market scenario would suggest.   Looking into this week's real events Marc Faber, one of the more reliable and sensible commentators on global stock markets, te...

A Parttime Pullback, - is that it?

Image
"Never Bet Against the Fed"   It is an old saying and of course, every time they say it, we wonder whether it still holds true.  Despite the blatant FED intervention in currencies and capital markets, we forecasted a pullback of sorts, let's check and see: At SingCapital, we run a best fund list (mutual funds), consisting of 97 funds, covering all asset classes and regions.  Out of these 97, 62 are in the red for the last week, including some bond funds. On a monthly return, almost half of them record a negative performance.  The ones, which recorded peak performance recently are those connected to Global Resources, like Latin America and China, while Gold related funds had a wild ride up, only to break down rather quickly thereafter.  Remember my forecast of last week: the first effect to show up to confirm a major peak and turnabout was ... "Gold prices to fall below $1338 per ounce." We can tick this one off then. In tandem, I expected a turn in the di...

A GRAND FINALE!?

Image
On the surface  The superficial observer might say, "nothing has changed, since last week". That is just it.  Time has passed. And one week in stock market terms is long indeed. Rarely has there been a week like the coming stirring up my apprehension as I agonise over two extreme outcomes:  The rally continues - Are we going to be bamboozled by a complete negation of stock market cycles? -  The correction comes - and we'll be knocked for six by a crash that ranks alongside 1998, 1987, 2002 - even the one, 80 years ago from which it took 15 years to recover?.  Drama?  You bet. CRASH OR EXTENSION OF THE RALLY? For complete remission of the "cyclically confirmed" downside potential, we don't need too much imagination:  If one trader can cause US indices to go into free-fall (-10% in 20 minutes, in May), we could easily envisage the world's key decision makers finding ways to do the opposite and -mustering the firmest of resolves - use every means at ...