Posts

The Eternal Bull Run Or....
Image
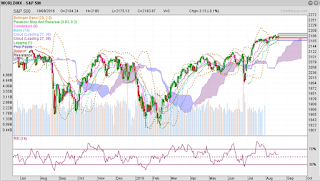
STOCKS RUNNING OUT OF STEAM... Investors keep telling me that their portfolios did not perform, while markets seem to have run up to new highs month after month.  Is that a fair assessment? Just a reminder to the reader: My investment strategy is medium term say 3-6 months, i.e. short term (days or less) consideration are really only important to me when I look to make changes to a portfolio. Anything said in this blog, be it outlook or forecast does not refer to tomorrow or end of the week. I only talk about the next 6-12 weeks' financial market probabilities and how I intend to trade. For more on my strategy please go to this page. Global Indices To check what happened over the last 12 months or more, I'd like you to take a look at the sample charts from the US, Europe and Asia in their respective currencies. US indices S&P 500, 1-year view, 2 major corrective moves; source: chartnexus S&P500: The large caps were favourites for many years but i...
Model Portfolio Update for August 2016

Image
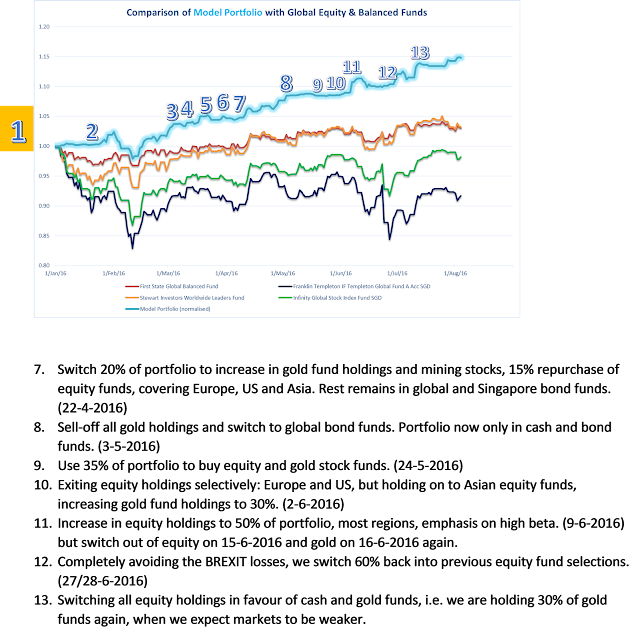
Model Portfolio as per  End of July 2016 Portfolio performance YTD: +15% The portfolio from January 1, 2016 to end of July maximum drawdown -4%, in February. outperforming a global equity fund by 25% year to date. 13 changes to the portfolio a model that is traded in real terms with all the charges and operational challenges.  For more insight please go to Model Portfolios .

MODEL PORTFOLIO UPDATE, May 2016

Image
The Latest Model Portfolio Update as per  End of May 2016 This update covers the period between January 1, 2016 to end of May 2016. January and February 2016 was a bad month for equities. Since January 1, to mid-February The  global equity fund  declined -17%. The maximum drawdown in the  global balanced fund  was <4%, remaining below the starting level during the period. Our  Model Portfolio  outperformed by a big margin: ... switched to safety (cash and bond funds) early in December 2015, so no negative figures for January.  ... For more detail, go to the page " MODEL PORTFOLIO"

MARKETS STILL OUT OF SYNC - May Update.

Image
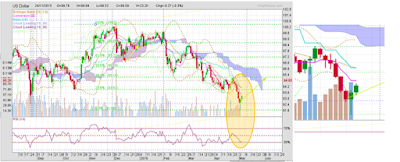
THE USD, GOLD & COMMODITIES 1. USD Perspective  Short to Medium Term  Much of the recent volatility in currencies, commodities and equity markets, is all too often blamed on the statements of a Ms Yellen or Mr Draghi, the JCB, the Chinese economic slowdown and of late, the US election dramas. But how do the fortunes of the US dollar affect the rest of the world? Traditionally, the USD is in a close relationship with precious metals and major commodities, as they are predominantly traded and priced in USD. Will that change? What will happen to commodity prices, global markets, the EUR, and the currencies of Asia-Pacific region?  USD since August 2015 to end of April 2016 (with enlarged cut-out of the orange oval marked period from April 25); SOURCE: Chartnexus My first chart shows the USD from August 24, 2015 to May 4, 2016. This period is full of meaningful Fibonacci aspects, which is why I am quite confident about my near-term prognosis. To p...

Financial Markets Out Of Sync Part II a)

Image
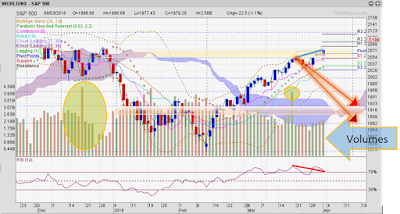
US and Europe - SHORT TERM UPDATE Before looking at Asian financial markets, allow me to briefly update you on what has transpired since I wrote part I & II in European an d US indices.  USA indices DJTA, short-term view: March peak, followed by the expected correction, DATA SOURCE: chartnexus The only index in the US, complying with my arrows is the Dow Jones Transport Average (DJTA), and it is taking the less precipitous path. The S&P 500, DJIA and RUSSELL 2000, are in sideways consolidation since the peak on March 22, without a meaningful decline . However, that is only half the story.  USD,October 2015 - today, fitting well into Fibonacci patterns; DATA SOURCE: chartnexus The USD has been losing strength against many world currencies in recent months, - just as I had envisaged  in November 2015 . Back then, everyone expected the USD to grow stronger in anticipation of the four interest rate hikes in 2016. Well, we have learned sin...

Financial Markets Out Of Sync Part II

Image
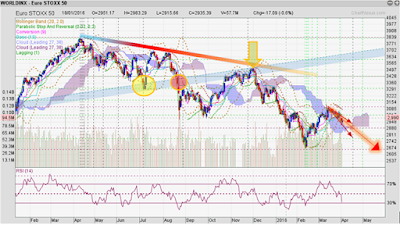
In continuing our short-term assessment of financial markets, today's report covers European ind ices.  If you want to check back on US and Canadian indices in Part I, click here . Last Sunday, I concluded that a new leg down in equities has started. It should reach a first significant low point around April 18, +/- 3 days. The sell-off could be strongest in large and mega cap stocks. Can this be confirmed by the cycle research in European indices? Part II - European Equities I indicated earlier that European equities have been correcting since last April.   1. EuroStoxx 50 EUROSTOXX50, a 1-year view: a 1 year correction that has more downside to come. DATA SOURCE: chartnexus In this chart I want show you how the price moves formed, where we are at now, and the outlook for the next few weeks. The peak in April 2015 is very prominent. Visually, it is also the starting point of the downturn. Focussing on the left half of the chart, please observe how this grad...

Financial Markets Out Of Sync Part I

Image
click here for  Financial Markets Out Of Sync Part II In my last post, I reintroduced my model . How else can I prove that my work carries benefits? Soon, I will elaborate on the model attribution, its strategy, and the reasoning behind the tactical changes over time.   Today, it's all about WHERE WE ARE RIGHT NOW with the markets. Last week, I said, global equities are getting out of sync. Now we can show how disjointed the markets have become. The information may help the experienced investor, though everyone wants direction and targets for future market moves. I will do so in this report, valid for the coming weeks, covering equities, commodities and currencies, each asset class in a separate blog post. It's an extra chance to adjust your positions accordingly, if you think my mumblings make sense.  Part 1 EQUITIES - USA and Canada equities I will show charts of Northern American, European, and Asian indices. You will note the divergence, and the...