A Turning Point in the Making
The WOW-factor to be had from combining technical analysis of the financial markets and the time cycles once again managed to make my hair stand on ends!
Last night's losses in the US stock markets came when Mr Average least expected it, - and the size of the step down mirrors the step up on July 7th. It also means that the pull back is a very short term affair, as the one day move has retraced almost 50% of the advance in the DJIA.
What becomes clear from the chart that the most recent advance, commencing July 5th, was doomed to fail as soon as it would enter the Ichimoku Cloud (blue shaded cloud form) at a point, where the formation was very dense. It is exactly the reason, why I recommended to remain on the sidelines during this hapless endeavour.
Now that we are out of the cloud, the immediate downward pressure will ease.
How much more downside is left?
Where are the potential support levels?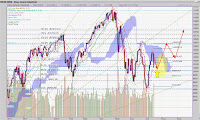
I will be happy with a re-test of the May 24th level, which is sufficient to warrant a serious call for the turning point to go back into rally mode, - a sharp rally mode:
The yellow arrow indicates the likely turning point, time and level. The yellow shaded area shows the likely path the rally will take - through the thinnest part of the cloud.
From around 10,000, The DJIA may rally to about 10,550 in early August, take a breather for a few trading days and then attempt the final assault for a September peak at 10,838, if we are lucky.
That means there are about 9% gain from now till September, +/- 2%. That is a winning ratio for most active traders. Click on the chart to enlarge and see more clearly.
More soon.
Last night's losses in the US stock markets came when Mr Average least expected it, - and the size of the step down mirrors the step up on July 7th. It also means that the pull back is a very short term affair, as the one day move has retraced almost 50% of the advance in the DJIA.
What becomes clear from the chart that the most recent advance, commencing July 5th, was doomed to fail as soon as it would enter the Ichimoku Cloud (blue shaded cloud form) at a point, where the formation was very dense. It is exactly the reason, why I recommended to remain on the sidelines during this hapless endeavour.
Now that we are out of the cloud, the immediate downward pressure will ease.
How much more downside is left?
Where are the potential support levels?

- The 50% retracement for the short term move in July would be 10,040
- 10,033 is the 61.8% Fibonacci level of the uptrend from July, last year to April of 2010.
- The 10,000 is more of a psychological barrier, and not mathematically supported
- Then there is 9,956, the low of May 24th
- Final stop (under extreme circumstances): 9,722, representing 50% Fibonacci (July 2009 to April 2010), at a crossover with the lowest of the Fibonacci fan levels (diagonal lines in a greenish yellow).
I will be happy with a re-test of the May 24th level, which is sufficient to warrant a serious call for the turning point to go back into rally mode, - a sharp rally mode:
The yellow arrow indicates the likely turning point, time and level. The yellow shaded area shows the likely path the rally will take - through the thinnest part of the cloud.
From around 10,000, The DJIA may rally to about 10,550 in early August, take a breather for a few trading days and then attempt the final assault for a September peak at 10,838, if we are lucky.
That means there are about 9% gain from now till September, +/- 2%. That is a winning ratio for most active traders. Click on the chart to enlarge and see more clearly.
More soon.


Comments
"Congrats and keep up this advanced way of communication to your investors. Very helpful.
Dr. AHB, July 21, 2010"
I like your blog. I was not able to make a comment as I did not have an account in Google or anywhere else.
I like the blog format because
(a) It is short and specific unlike your newsletters
(b) It does not have too many disclaimers
(c) I can even read this on my Iphone/ blackberry
Q: Will you go in an out in Aug or stay in till Sep?
Regards,
Y....
"Very good start and likley will lead to many questions from your clients !!
I like this short 1 page kind of quick analysis after a major move ...
Regards
TV
On Sat, Jul 17, 2010 at 11:06 AM"
"Hi Rainer,
Excellent, please keep it up. "